BTCINVESTING
@t_BTCINVESTING

What symbols does the trader recommend buying?
Purchase History
پیام های تریدر
Filter
Signal Type
BTCINVESTING
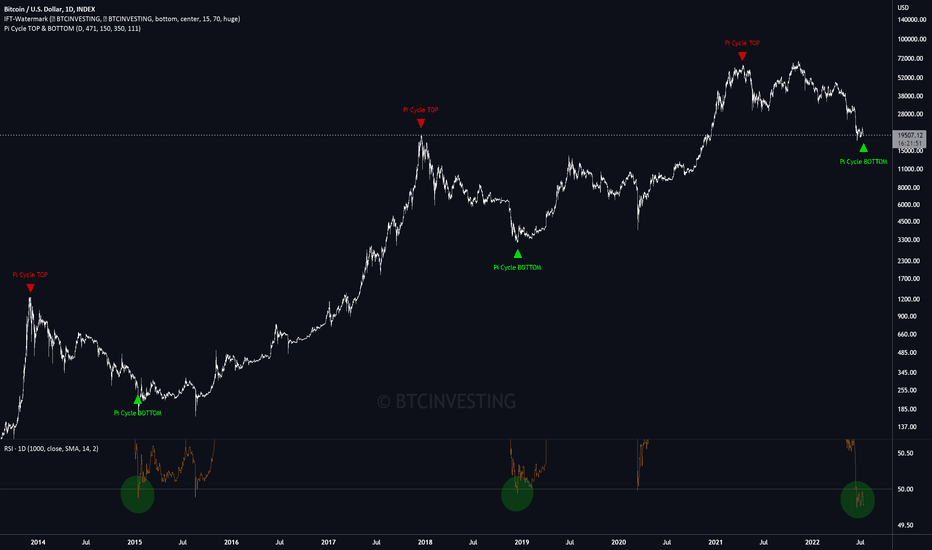
The Indicator Pi Cycle was been very accurate in the past. It has been quite effective in determining tops and bottoms. About Pi Cycle Indikator TOP: It uses the cross of 111 day SMA and 350x2 day SMA. About Pi Cycle Indikator BOTTOM: It uses the cross of 150 day SMA and 471x0.745 day EMA. And the RSI is below 50, which is also a clear bottom signal imo. My recommendation as always: Buy the dips and hodl. 😀 -- Let's see what happens. Happy trading. BTCINVESTING -- -- My Post Apr 17, 2021 "BTCUSD: Whats about PiCycle? A bearish signal?" [url= ] My Post Dec 15, 2021 "BTCUSD: Difference - Bearish Downtrend | Bullish Accumulation" [url= ] My Post Apr 15, 2019 (3 year ago!). I was one of the first btw. ;-) [url= ] --Cross 3 days confirmed. :-)on track. :-)
BTCINVESTING
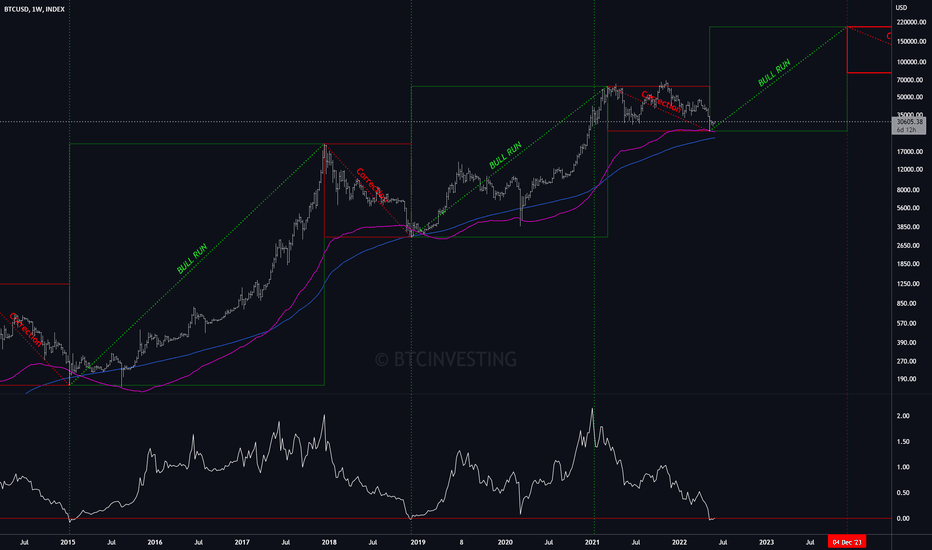
Hello my friends! Bitcoin is on track again. I haven't posted that much in the last time. My last post was from 9 February. Since that time I have been buying the dips step by step. My last buy was at 12 May. I waited deliberately until I was writing this post. I wanted to make sure we hit the bottom. We might still have a small dip at the very maximum, but the next BULL RUN has been launched. NOW to my chart: To evaluate the long-term bottom, its helpfull to use Bollinger Band (Timeframe 3D, Length 150, Source low and StdDev 1.618) in combination with Keltner Channel (1W, Lower Line, Length 86, Multiplier 4, ATR 172) and SMA (1W, 200). The two important indicators (BB and KC) were touched. Only the 1W-SMA200 has not yet been touched. This can still happen in the near future at a possible retest or sideways movement. But is not mandatory. Bitcoin is on track at its steady uptrend. Our stairs to heaven! My recommendation as always: Buy the dips and hodl. 😀 -- Let's see what happens. Happy trading. BTCINVESTING -- -- My Post Dec 15, 2021 [url= ] -- My Post Apr15, 2019 (3 years ago!): "BTC: Why will 1 Bitcoin really be worth more than USD 1 million?" I was one of the first btw. ;-) --And look at the 1M EMA50. Nothing more to say. It will bounce my dear friends. :-)retest...aroon gives us also a clear signal...keep it simple. no fear!so far so good. we are back over the w200ma. close is important. :-)
BTCINVESTING
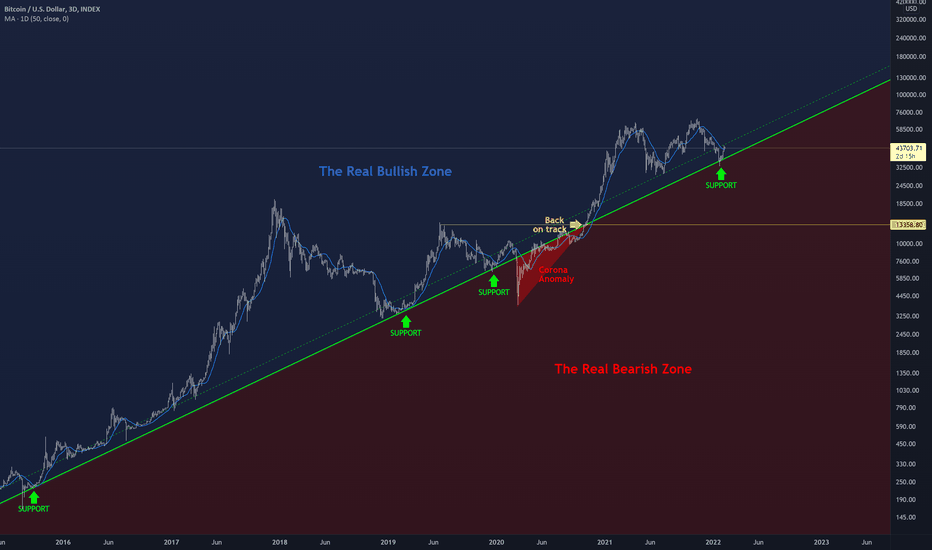
Hello my friends! Again a chart that shows that we are bullish as always. If we look at the strong support areas and draw a line, we get a clear picture imo of where we are. I don't understand for a long time, the talk bitcoin is bearish or could get bearish. Even in 2018 we were not bearish. Okay, Bitcoin is volatile. But Bitcoin is volatile in the uptrend. Thats it. You know my charts from the past. Ultimately, Bitcoin is in a steady uptrend. Like the stairs to heaven. Only the Corona anomaly has broken that. In my eyes we are always on track. And the only recommendation from my point of view is buy and hodl. And as a Strategy: Buy the dip. 😀 -- Let's see what happens. Happy trading. BTCINVESTING -- PS: -- My Post from Jan26, 2022: "BTCUSD: Keep it simple and easy - 0 1 2 3 4 5" [url= ] My Post from Jun7, 2021: "BTCUSD: Another bad news for bears!" [url= ] My Post Apr15, 2019 (3 years ago!): "BTC: Why will 1 Bitcoin really be worth more than USD 1 million?" I was one of the first btw. ;-) [url= ] --47k. main support should be confirmed.Bottom reached! New Chart coming soon.
BTCINVESTING
Hello my friends! This Post has four words: Go long dont short. (and ... MA 50 X MA 200 a dead cross is not always a dead cross). 😀 When I read thecryer 's post this morning, this 4-word post came to my mind. I think he writes very true words that we should all keep in mind. Well done. I quote him: ... -- thecryer : "... - So what i want to explain clearly is : - Whales are just waiting for a big dip to buy your Bitcoins , they always cumulate BTC , they move them out from exchanges and keep in their wallets. no matter if BTC falls to 1000$, they will buy more. - TheKing is still Alive because Whales never dropped their BTC , they dropped a bit for living, but this new nerd generation understood about the meaning of freedom in the "Satoshi Whitepaper". - Most of the Whales are not driving a Lambo but drive a small car, they fly coach, they visit the planet, and they go supermarket like you and me. - Retailers try to win money in the Both Ways because they are just greedy, Long and Short BTC , the problem is when you Short BTC you don't have your coins... you have your "Short Contract" (x2 at least). - When you are shorting a disinflation technology, it means you are fighting with something made for a best future, less poverty, more equitability, better world for your family. - When you are shorting BTC you are taking the risk that the exchange you are using close or get a hack, you cannot move a contract in an hardcore Wallet, but if you buy BTC , you can move coins in your Ledger. - When you are shorting BTC , you own nothing. Not your coins. Not your Key. just the wind. - i hope this makes some people's open eyes about a greedy financial system. - Believe in TheKing! https://www.tradingview.com/chart/BTCUSDSHORTS/tecb3pLx-Short-TheKing/#tc7866227 ..." -- Let's see what happens. Happy trading. 😀 BTCINVESTING -- PS: -- Post from Dec 4, 2021: "BTCUSD: And another bad news for bears: buy the dip!" [url= ] My Post from Jun6, 2021: "BTCUSD: Another bad news for bears!" [url= ] My Post Apr 15, 2019 (3 years ago!). I was one of the first btw. ;-) [url= ] --if we break this support, we could turn bearish.here we are imo🔥BREAKING Russian government agree to legalize owning, buying and selling Bitcoin. Lets go ... :-)
BTCINVESTING
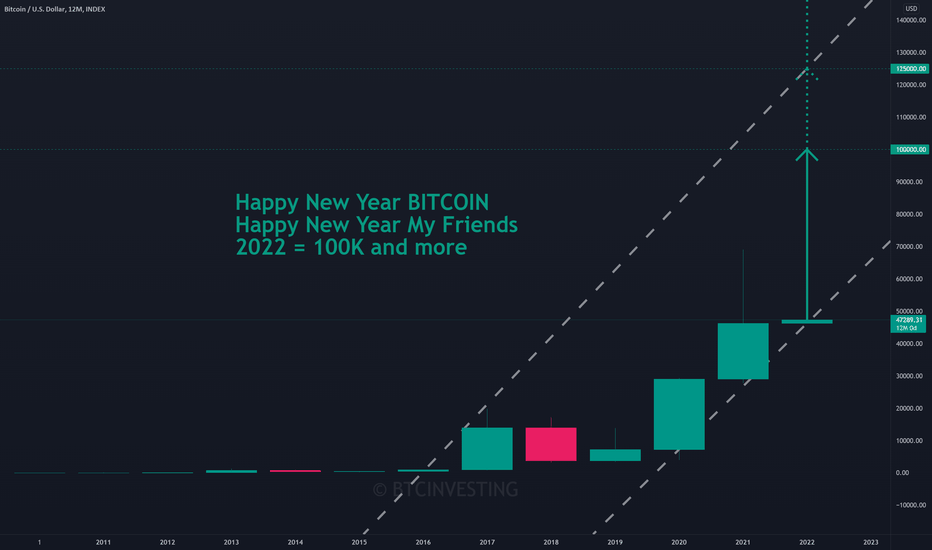
Hello my friends! Happy New Year. This is our Trend Channel. Keep hodling. 😀 -- Let's see what happens. Happy trading. 😀 BTCINVESTING -- Post from Dec 4, 2021: "BTCUSD: And another bad news for bears: buy the dip!" [url= ] My Post from Jun7, 2021: "BTCUSD: Another bad news for bears!" [url= ] My Post Apr 15, 2019 (3 years ago!). I was one of the first btw. ;-) [url= ] ---- chart with log scale. nothing more to say. :-) --year candle switched to green... :-)
BTCINVESTING
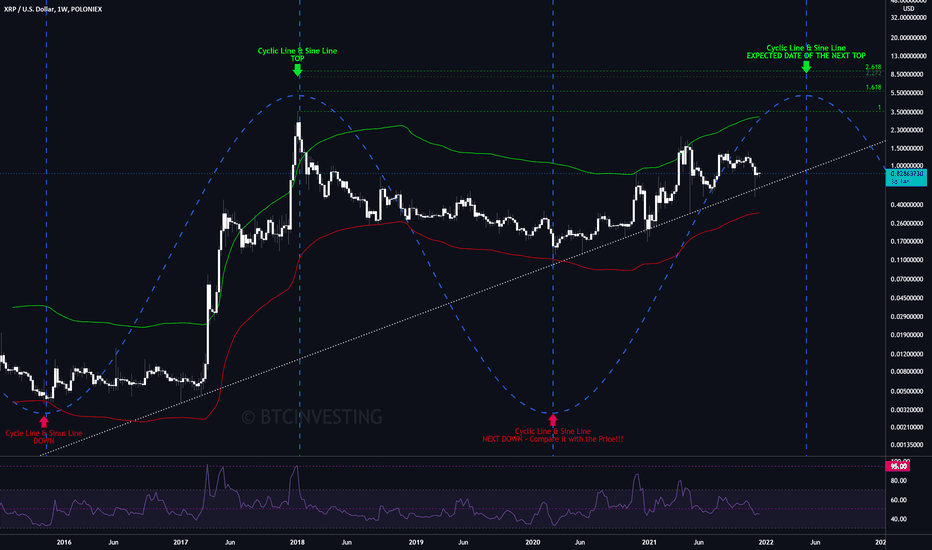
Hello my friends! this time I have played with Cyclic Line & Sine Line. And I think a highly interesting result has shown up. If we put Cyclic Line & Sine Line at the low point in Nov 2015 and the high point in Jan 2018 we get the next low and high points. The low point Mar 2020 is amazingly hit almost on the day!!! This results in a next high in May 2022. If the Trend-Based Fib Extension is applied at the same points, there are clear targets at 1,618 (5.71 USD) to 2,618 (9.18 USD). 2.272 is at just under 8 USD. My band used is a Daily 350 MA multiplied by 3.618 and 0.382. -- Let's see what happens. Happy trading. 😀💯🚀 BTCINVESTING -- My Post from Sep 13, 2019 has forecasted the low point exactly! [url= ]hi, no worries. we are still on track. :-)
BTCINVESTING
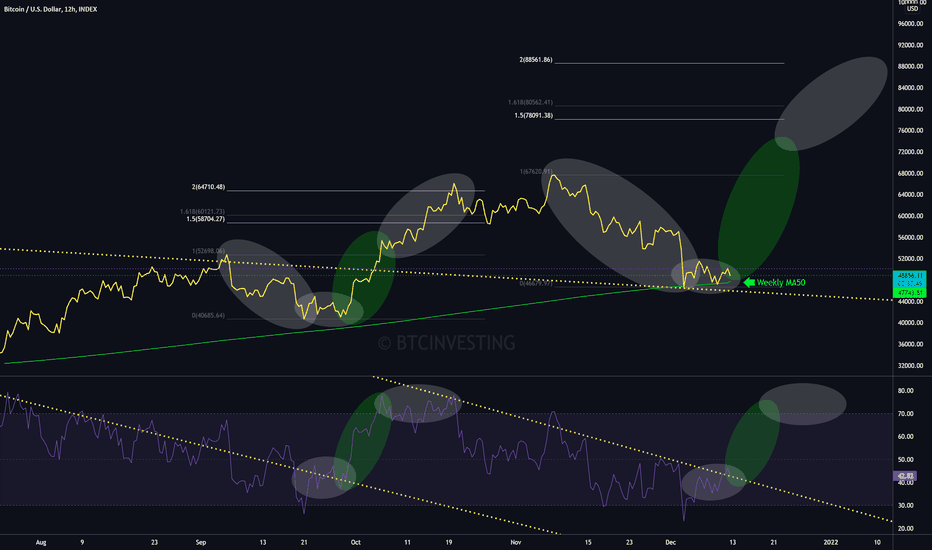
Hello my friends! We closed the week above 50 K. So far so good. If the pattern of recent months is repeating, the picture for December will be positive. The Weekly MA50 has given strong support so far. This means that our Local Bottom could have been here. If we look at the RSI, this underlines this view. On the last impulse, we reached the Fib area of 1.5 to 2. If this pattern repeats, the next possible local top would be between at 75K and 90K. Lets cross our fingers! 🤞 -- Let's see what happens. Happy trading. 😀 BTCINVESTING -- My Post from Dec 10: "BTCUSD: News for bears and bulls: Here we are! [url= ] My Post from Dec4: "BTCUSD: And another bad news for bears: buy the dip!" [url= ] My Post from Jun7: "BTCUSD: Another bad news for bears!" [url= ] My Post Apr 15, 2019 (2,5 year ago!). I was one of the first btw. ;-) [url= ] --
BTCINVESTING
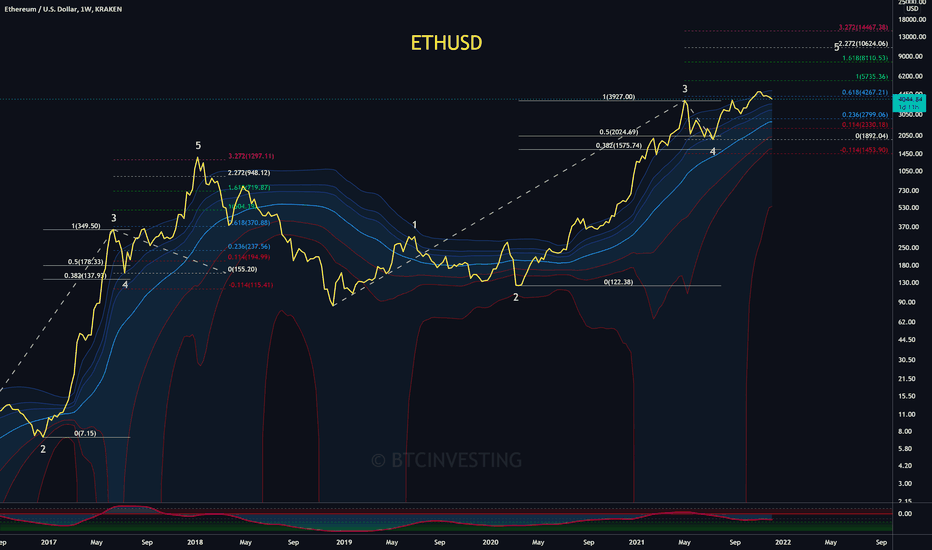
Hello my friends! If we analyze Ethereum with the Trend Based Fibs Extension, a pretty clear picture appears. On the last up, the correction to the 4 was in the Fib 0.5/0.38 area. This time we also corrected into this area. If we now apply the Trend Based Fibs Extension, we get a pretty clear target picture at minimum 1.618 (8,000 USD). If ETH were to go to Fib 3.272 like last time, we would be at around 14,400 USD this time. If we calculate conservatively and we reach 2.272, the target point would be slightly above 10k. Lets cross our fingers! 😀 BTW: My Bollinger Band is here 350 Daily (StdDev 0.618, 1 and 2). -- Let's see what happens. Happy trading. 😀 BTCINVESTING --Middle Band (blue middle line) touched. it should hold.On track again ... 👍
BTCINVESTING
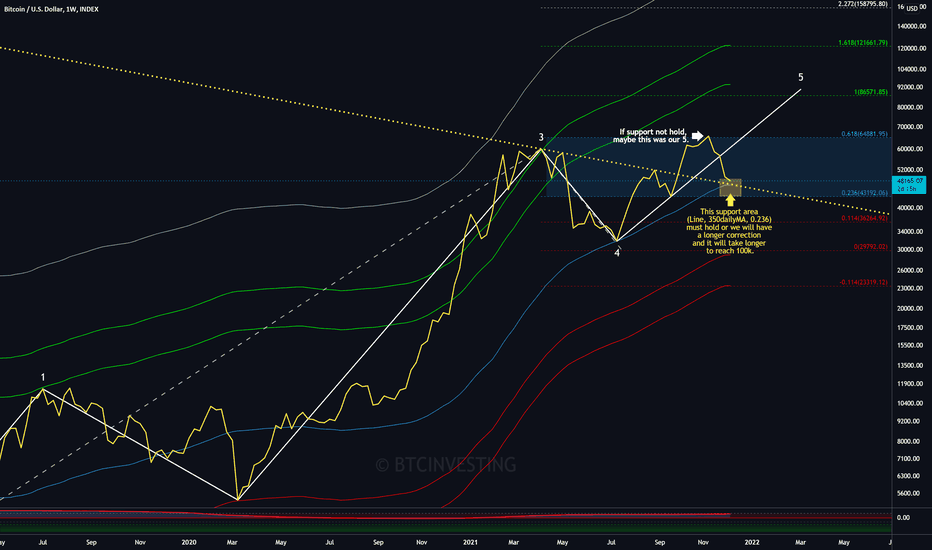
Hello my friends! Here is a post about the status quo. For everyone, for bears and bulls. For Hodler like me, the situation is nothing special. I am still bullish. But for everyone else, the info might be interesting. So, where do we are? The key question is, was 69K our 5. If the support (yellow box) holds, then it was not the 5! We are just at a very important support area that needs to hold: The Support line (down from the 3), the daily 350MA and the 0.236 from the Trend Based Fib. For such post I choose only the price line in the weekly chart. Here, all extreme movements are hidden. If all the strong supports do not hold, then another correction around the red trend band (0.618x350MA) is possible. Currently, however, everything is still okay. The closing price of this week and next week are key. Lets cross our fingers! :-) -- Let's see what happens. Happy trading. :-) BTCINVESTING -- My Post from Dec4: "BTCUSD: And another bad news for bears: buy the dip!" My Post from Jun7: "BTCUSD: Another bad news for bears!" My Post Apr 15, 2019 (2 year ago!). I was one of the first btw. ;-) --close up:Weekly close above 50k with a green candle.
BTCINVESTING
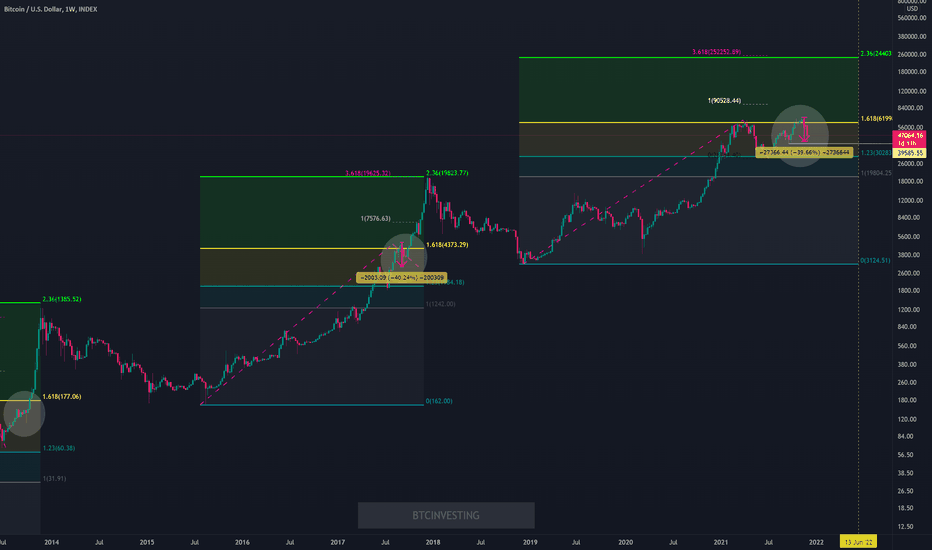
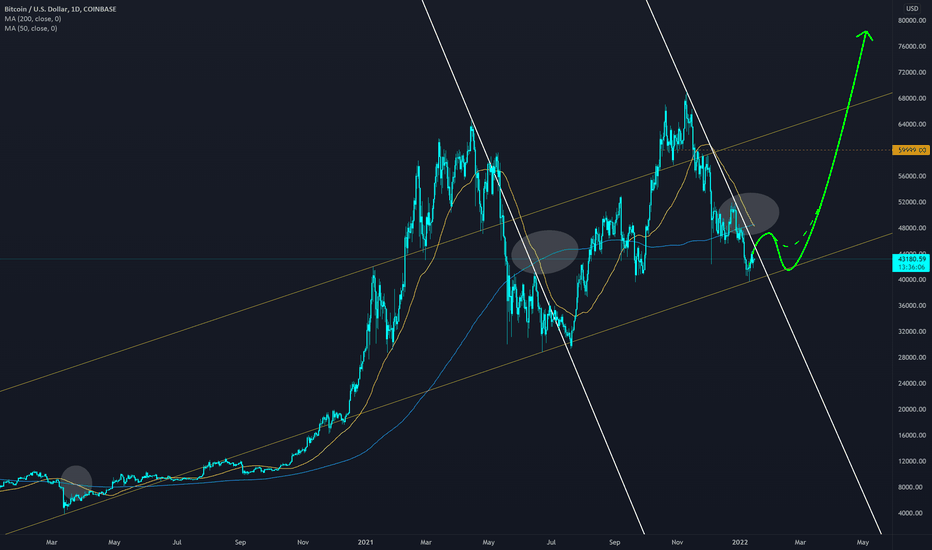
Hello my friends! This post is for all the fearful who have not yet been in the market in 2017. Corrections of this kind in the bull cycle are quite normal from my point of view. I still see us on track. I have analyzed the situation with the Trend-Based Fib Extension and also with the "normal" Fibs. In all cycles we could come to a similar result: the first top was at 1,618 and the main top was at 2.36. If we compare "normal" Fib with Trend-Based Fib Extension, we would reach the top at 3,618. Exactly at the same point. One more remark, even if we only reach the 1 at Trend-Based Fib Extension, that would be at 90K and the 1,414 would be at my minimum top of around 115K. As a Hodler who buys Bitcoins and does not sell them, I am still quite relaxed about this move. The main resistance at 39.5K has held. Thus, this could be a roughly -40% move like 2017. Next week it can go straight up again. Lets see. Lets cross our fingers! ;-) -- Let's see what happens. Happy trading. :-) BTCINVESTING -- My Post from Jun7: "BTCUSD: Another bad news for bears!" [url= ] My Post Apr 15, 2019 (2 year ago!). I was one of the first btw. ;-) [url= ]This zone should hold. Detail chart.39585 should hold. chart is still valid snd bitcoin on track.
Disclaimer
Any content and materials included in Sahmeto's website and official communication channels are a compilation of personal opinions and analyses and are not binding. They do not constitute any recommendation for buying, selling, entering or exiting the stock market and cryptocurrency market. Also, all news and analyses included in the website and channels are merely republished information from official and unofficial domestic and foreign sources, and it is obvious that users of the said content are responsible for following up and ensuring the authenticity and accuracy of the materials. Therefore, while disclaiming responsibility, it is declared that the responsibility for any decision-making, action, and potential profit and loss in the capital market and cryptocurrency market lies with the trader.