
BOT721
@t_BOT721

What symbols does the trader recommend buying?
Purchase History
پیام های تریدر
Filter

It looks like we have a deviation below the demand zone and the $13.8 support, which could present a buying opportunity.I’m waiting to see if the price finds support around $14.4.If the price drops below $14 and stays there for an extended period, I’ll reassess the trade, as we could see another leg down toward the $8-$11 zone, where stronger support is likely.For now, the weekly oscillators look decent—Stoch RSI is close to a bullish cross, and RSI has found support at 40.

Celo has bounced every time it touched the lower range around $0.40, usually reaching at least 0.25.However, given the current market conditions, I expect either more downside or a sideways movement in the next few days.The Stoch RSI is gearing up for a bullish cross on the weekly, but historically, the first cross is often followed by a negative one, before a second bullish cross that truly pushes the price higher. So while we might see some short-term upside, we should also be prepared for lower prices before a more significant rally kicks in.

TIA has dropped below $3.7, the lower boundary of its range, which isn't necessarily a bad thing.If the price manages to reclaim $3.7, it would confirm a major fakeout, potentially pushing the price back up to $5-$6.In the short term, we might see a small bounce toward the 21 EMA on the daily timeframe, accompanied by a bullish cross on the Stoch RSI.After that, another pullback could happen, setting up a second bullish cross on the Stoch RSI—which, historically, has often led to stronger upward moves.

Considering that we are below the 12/21 EMA on the daily timeframe, the trend remains downward.The EMAs may continue to decline before the price temporarily moves above them, creating a false impression of a trend reversal.After that, we could see a drop below $3.8.
Alphabet (GOOGL) Analysis – Potential Downside Risks
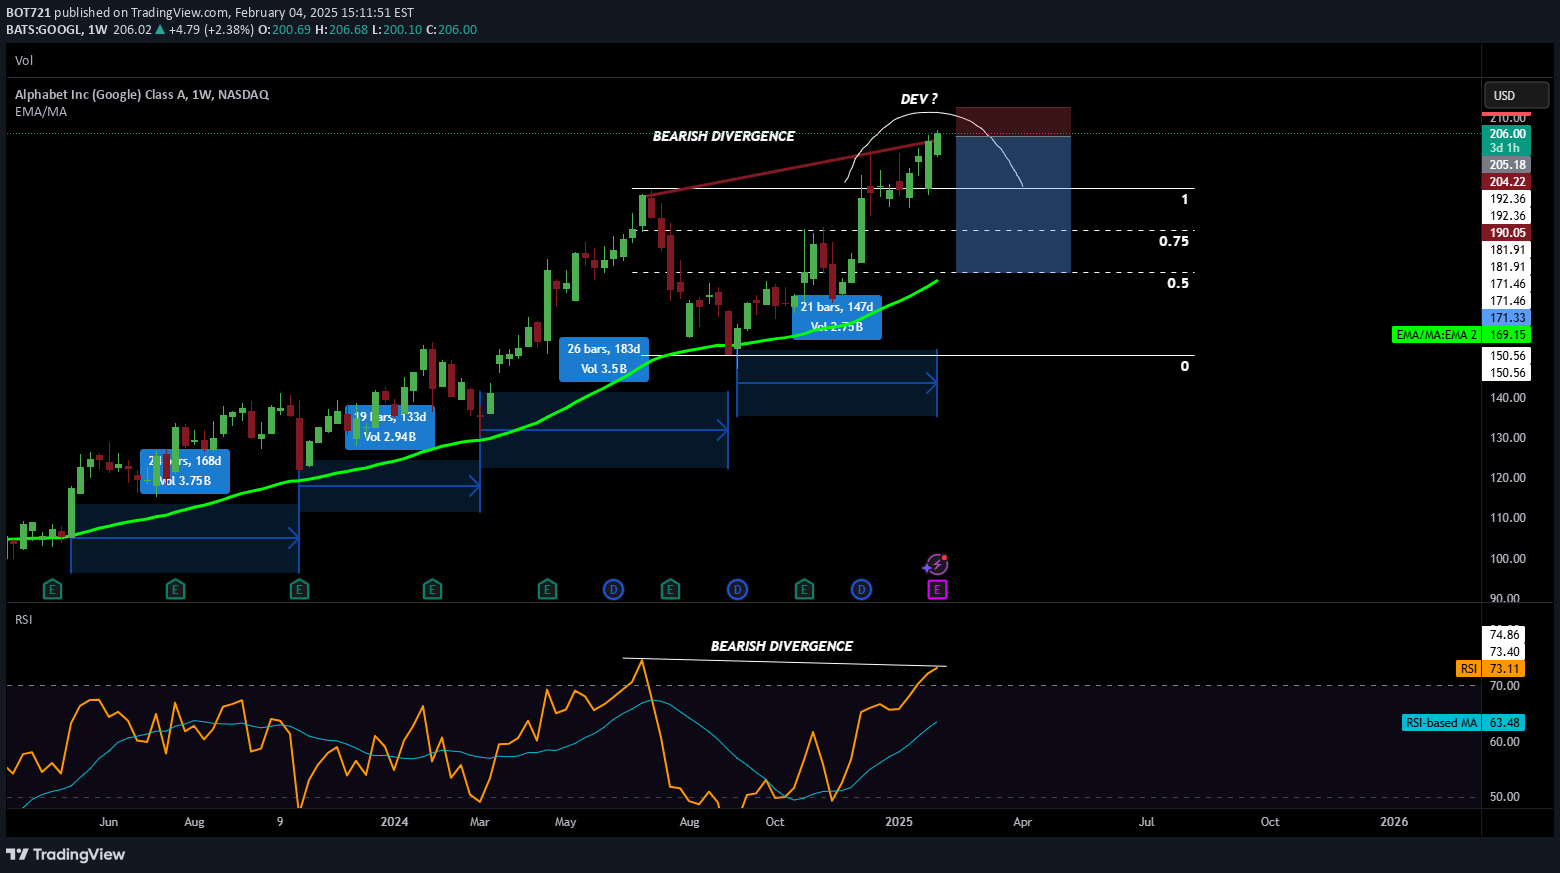
Alphabet is currently trading at $205. While it could still move higher, several factors might drive the price lower soon: Extended Distance from 55 EMA: The stock hasn’t touched the 55-day EMA for 147 days. While this doesn’t mean a pullback will happen immediately, a sharper downside move is possible. Bearish Divergence: The RSI has formed a lower high, while the price has made a higher high, signaling a potential bearish divergence. Fundamental Risks – AI & Earnings: Earnings Report on Tuesday: Alphabet will report its earnings, and investors will focus on its high AI-related expenditures. Revenue Growth Concerns: The company may have experienced slower revenue growth in Q4 due to weakness in advertising and cloud services. Competitive Pressure in AI: Chinese startup DeepSeek recently launched low-cost AI models, raising concerns over a potential AI price war, which could impact Alphabet’s profitability. While Alphabet remains strong, combining technical weakness and fundamental risks (earnings pressure, AI spending, and increased competition) could lead to a correction. If a pullback occurs, the 55 EMA could act as a key support level. 92% of positions are long. We all know the old saying—most people lose in trading. So if 92% of the market is long, we should at least be short for the moment. This extreme bullish positioning suggests a potential contrarian opportunity, as overly crowded trades often lead to sharp reversals.


SEI is currently in a support zone at 0.25 and near the lower boundary of the descending channel. The price may continue to move within this descending channel until it reaches the 0.30–0.28$ range.A reaction is likely to occur from that zone where we have the nPOC and the 61.8 Fibonacci retracement level.

GRT seems to be heading toward the nPOC, considering that the USDT.D chart is also in a support zone, increasing the chances of GRT reaching 0.14. Interestingly, the stochastic RSI also attempted a positive cross but was rejected. Moreover, the price forms a descending triangle. These combined factors make me think there's a 60–70% chance we'll see GRT at a lower price soon.
CRV LONG

After experiencing a parabolic increase from 0.221 to 1.328, the price has oscillated within a descending trend, forming progressively lower highs. I believe there is still an opportunity to position long when the price revisits the demand zone, which aligns with the 61.8% Fibonacci retracement level and the 2024 annual opening price slightly below it. However, if the price breaks below this demand zone, another opportunity may arise around the 0.25 level, where we also have an nPOC (naked Point of Control).
AVAX LONG SETUPS

After starting the year with a 27% increase in less than a week, followed by a drop that brought the price below the year's opening, it seems the price is consolidating between 44 and 34. I don't think this is the best time to enter a position, whether long or short unless you're a scalper. That’s why I believe the area between nPOC and 0.25 could offer some decent long opportunities with risk-reward ratios of over 3:1.We should wait to see how the price reacts in those areas. Specifically, we should wait for the price to drop below nPOC or 0.25; when the price moves back above those areas, we can enter a long position.
Disclaimer
Any content and materials included in Sahmeto's website and official communication channels are a compilation of personal opinions and analyses and are not binding. They do not constitute any recommendation for buying, selling, entering or exiting the stock market and cryptocurrency market. Also, all news and analyses included in the website and channels are merely republished information from official and unofficial domestic and foreign sources, and it is obvious that users of the said content are responsible for following up and ensuring the authenticity and accuracy of the materials. Therefore, while disclaiming responsibility, it is declared that the responsibility for any decision-making, action, and potential profit and loss in the capital market and cryptocurrency market lies with the trader.