
B9A-88652-NisarAhmad
@t_B9A-88652-NisarAhmad

What symbols does the trader recommend buying?
Purchase History
پیام های تریدر
Filter
B9A-88652-NisarAhmad
حرکت انفجاری بیت کوین: راز الگوی پرچم گاوی و نقاط کلیدی حمایت و مقاومت!

Structure: Bullish pennant / flag after a strong impulsive rally from the 114k–125k zone. The consolidation you’ve drawn (red triangle) shows decreasing volume — typical before a breakout. Support: around 120.0–121.0k Resistance: 125.5–126.0k
B9A-88652-NisarAhmad
ETH/USD
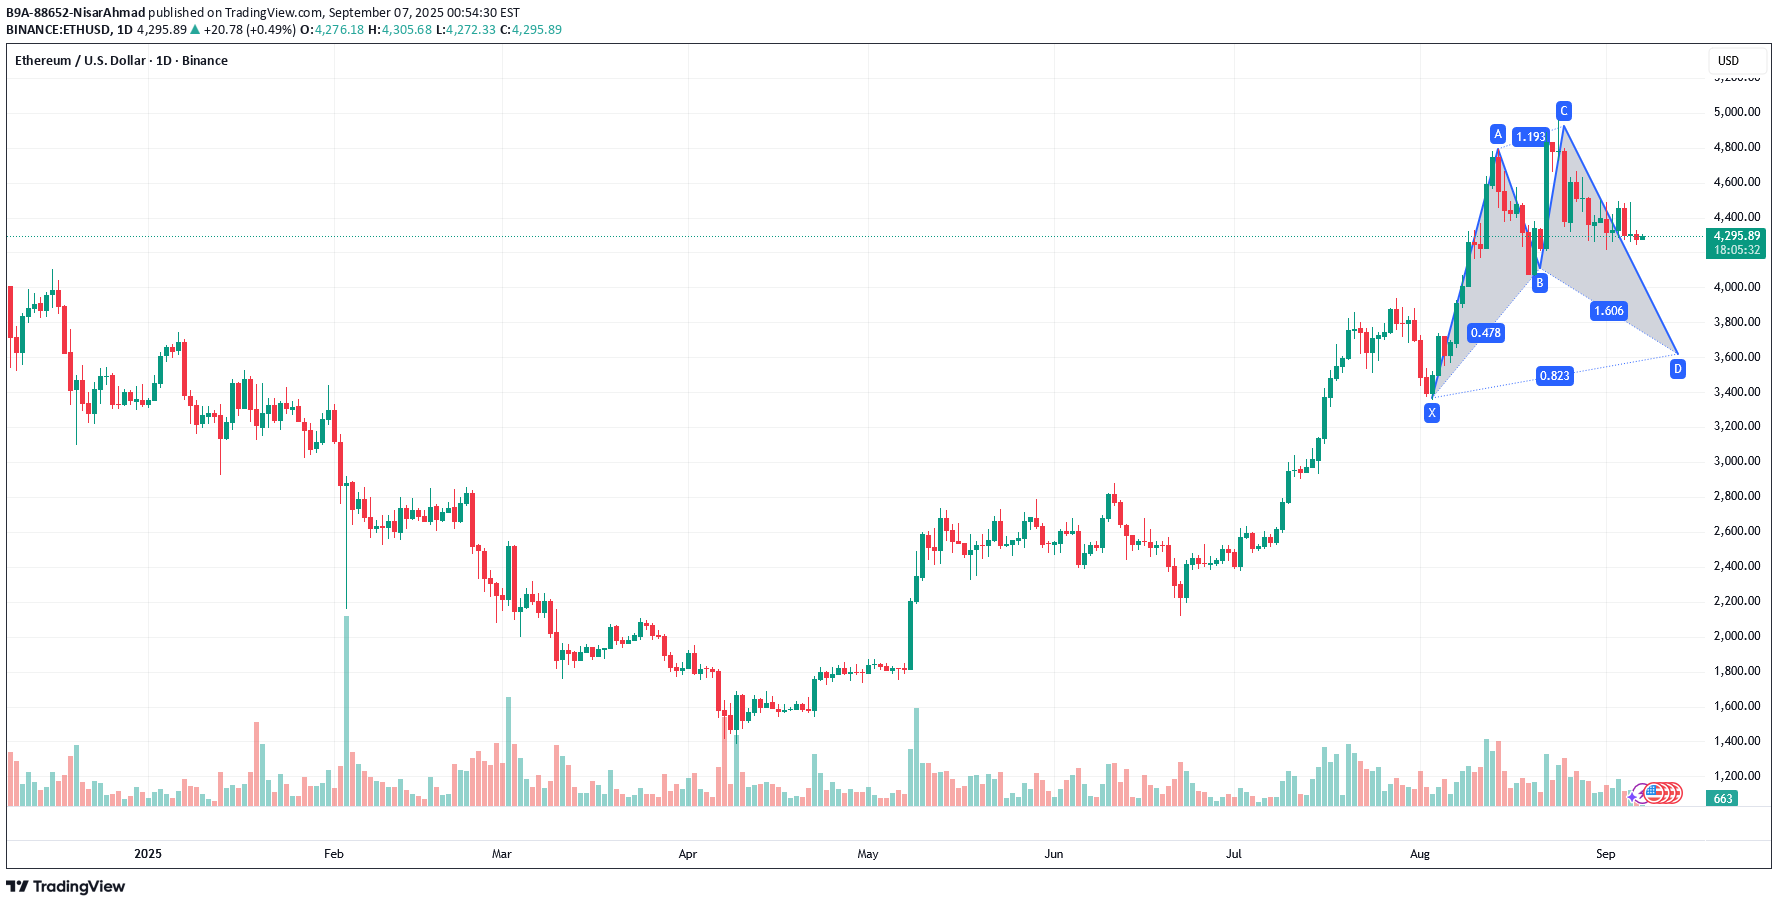
Short Setup (toward D) Entry: ~$4,300–4,400 (current consolidation zone). Stop-Loss: Above $4,700–4,800 (invalidates bearish setup). Target 1: $3,900 (mid-level support). Target 2: $3,600–3,700 (D point completion).
B9A-88652-NisarAhmad
BTC/USD
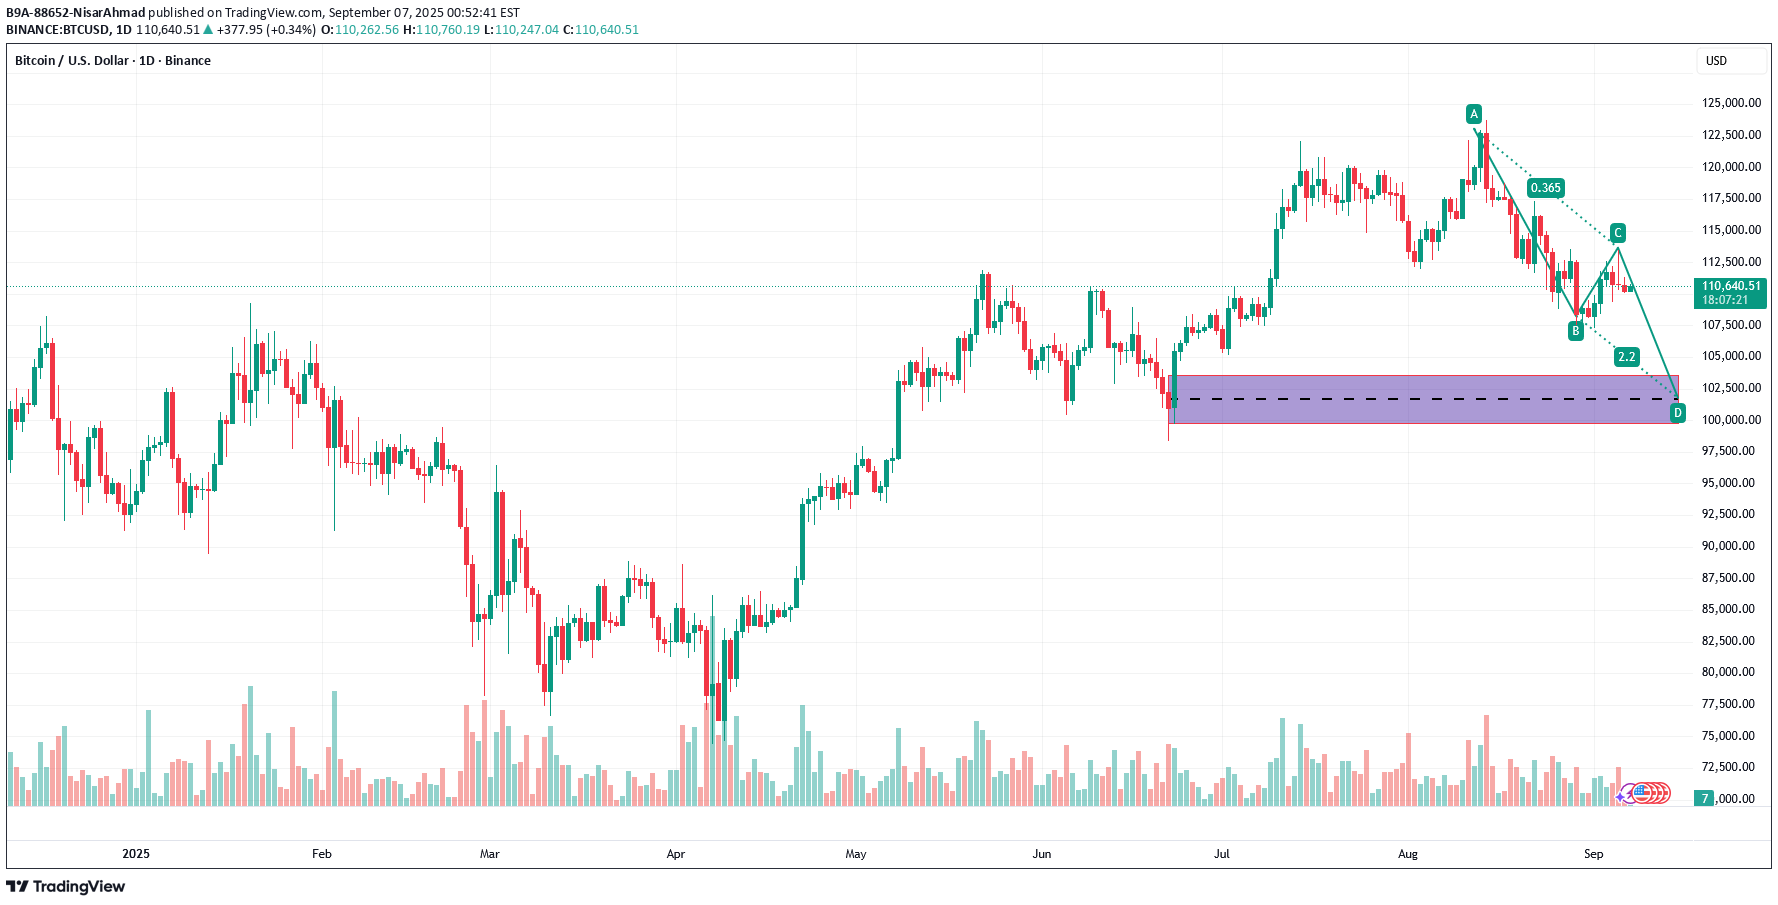
Reversal/Bounce Setup (at D zone) Entry: Near 100,500–102,000 (demand zone). Stop-Loss: Below 98,500–99,000 (clear break of support). Target 1: 107,000–108,000 (first bounce). Target 2: 112,000 (C point retest).
B9A-88652-NisarAhmad
B9A-88652-NisarAhmad
ETH/USDT

A bullish flag is a technical chart pattern that signals a potential continuation of an upward trend in the price of a financial asset, such as a stock, cryptocurrency, or commodity. This pattern is used by traders to identify opportunities to enter long positions during a market uptrend.
B9A-88652-NisarAhmad
Gold/USD

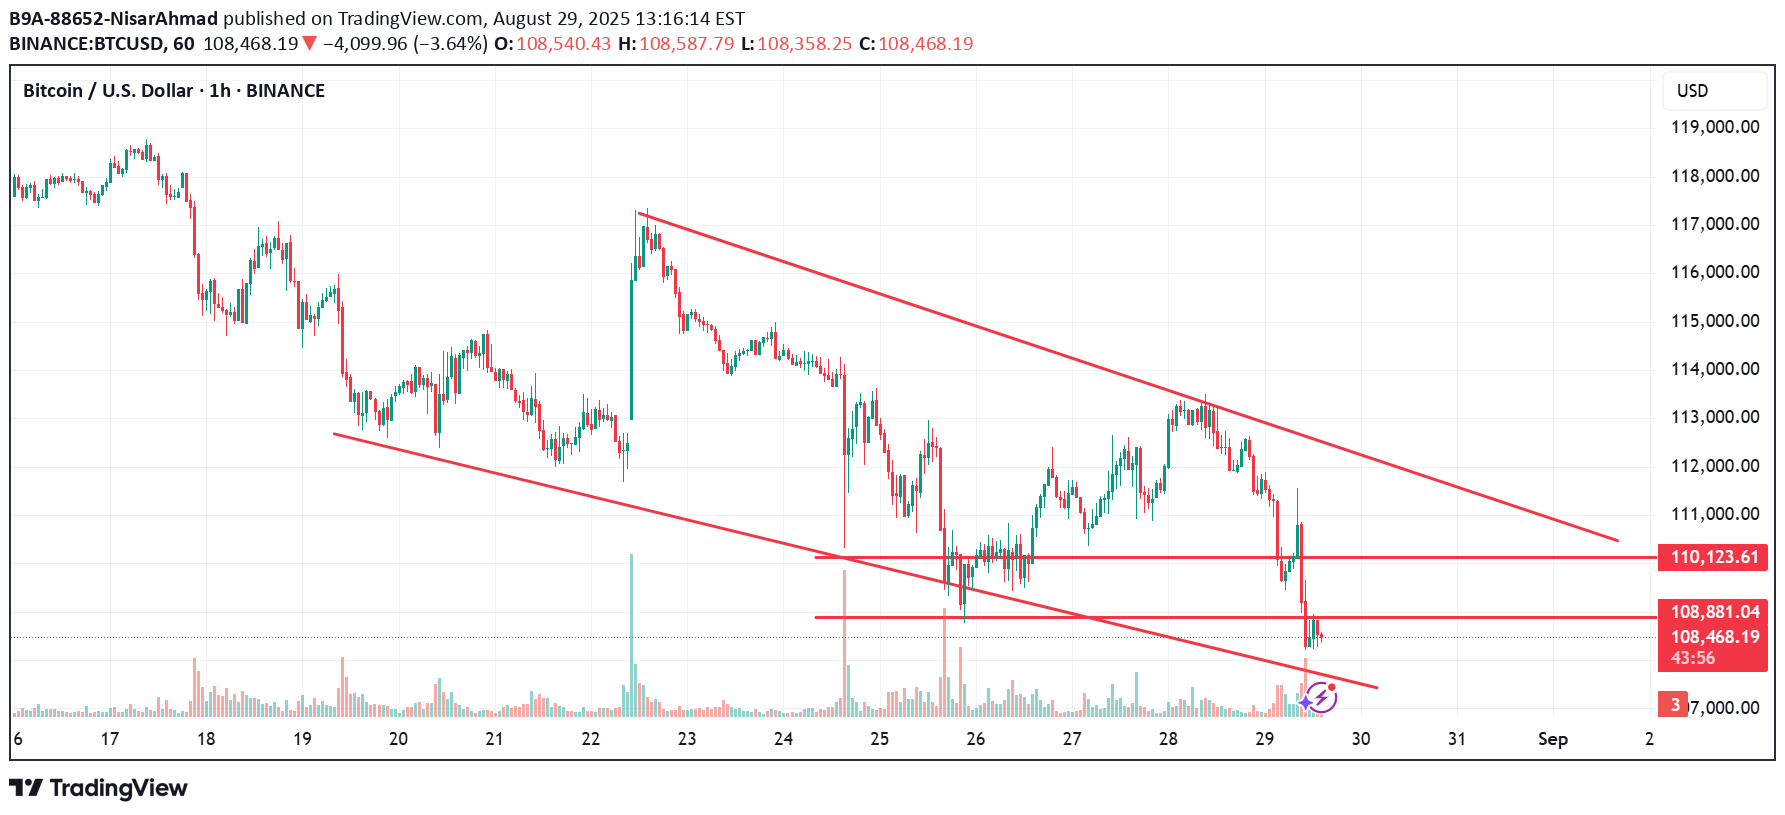
A **trendline** is a straight line used in charts to represent the general direction or pattern of data over a specific time period. It helps to visually indicate whether the data is trending upwards, downwards, or staying relatively constant. Trendlines are widely used in technical analysis, particularly in financial markets, to identify trends in stock prices, currencies, or commodities. They can be drawn on various types of charts like line charts, bar charts, or candlestick charts to predict future movements based on past performance.
B9A-88652-NisarAhmad
Gold/USD

A breakout strategy is a popular trading strategy used in financial markets, especially in technical analysis. It involves identifying key levels of support and resistance on a price chart and trading the subsequent breakout from those levels. Here's how it generally works:1. Identifying Support and Resistance**: Traders first identify significant support and resistance levels on a price chart. Support is the level where the price tends to find buying interest, preventing it from falling further. Resistance is the level where the price tends to encounter selling interest, preventing it from rising further.2. Waiting for Breakout**: Once support and resistance levels are identified, traders wait for the price to break out above resistance or below support. The breakout is typically confirmed when the price closes above resistance or below support, preferably on higher than average volume.3. Entry**: Traders enter positions in the direction of the breakout. For a bullish breakout (above resistance), they might buy, while for a bearish breakout (below support), they might sell short.4. Stop-loss and Take-profit**: Traders usually place stop-loss orders to limit potential losses if the breakout fails to sustain. Take-profit orders are placed to secure profits if the price moves significantly in the desired direction.5. Confirmation and Monitoring**: Some traders prefer to wait for confirmation of the breakout by waiting for the price to pull back and retest the breakout level. If the level holds as support or resistance after the breakout, it adds confirmation to the trade. Traders then monitor the trade's progress and adjust stop-loss and take-profit levels as necessary.6. Risk Management**: As with any trading strategy, risk management is crucial. Traders should only risk a small percentage of their trading capital on each trade and ensure their risk-reward ratio is favorable.Breakout strategies can be applied to various timeframes and markets, including stocks, forex, commodities, and cryptocurrencies. However, false breakouts are common, so traders should use additional indicators or confirmatory signals to increase the probability of successful trades. Additionally, it's essential to consider the overall market conditions and factors that could influence price movements.
B9A-88652-NisarAhmad
Gold/USD

The AB=CD pattern is a popular harmonic pattern in technical analysis, used to predict potential reversals or continuations in price trends. In the bullish AB=CD pattern:- **AB leg**: This is the initial uptrend where the price moves up.- **BC leg**: After reaching a peak, the price retraces downwards, forming the BC leg.- **CD leg**: From the BC low, the price reverses and moves upwards again, ideally equal in length to AB.Traders often look for Fibonacci ratios between these legs to confirm the pattern. It's considered complete when the CD leg reaches a Fibonacci extension of 1.27 or 1.618 of the AB leg, indicating a potential reversal point. Traders typically look for additional confirmation through other technical indicators before making trading decisions based on this pattern.
B9A-88652-NisarAhmad
Gold/USD

A "bullish Gartley" refers to a specific pattern that traders look for in financial markets, particularly in technical analysis, to potentially predict future price movements. It's named after its creator, H.M. Gartley, who introduced it in his book "Profits in the Stock Market" in 1935. The bullish Gartley pattern is a harmonic pattern that consists of four distinct price swings or legs. These legs are labeled XA, AB, BC, and CD. The pattern typically forms after a significant downtrend and indicates a potential reversal to the upside. Here's a breakdown of the legs of a bullish Gartley pattern: 1. XA: This is the initial leg of the pattern and represents the initial impulse move downward. 2. AB: After the XA leg, there is a retracement upward, forming the AB leg. This retracement should ideally reach a Fibonacci level of either 0.618 or 0.786 of the XA leg. 3. BC: Following the AB leg, there is another downward move forming the BC leg. This leg typically retraces 0.382 or 0.886 of the AB leg. 4. CD: Finally, the pattern completes with the CD leg, which is an extension of the BC leg. The CD leg should ideally reach the 1.272 or 1.618 Fibonacci extension of the BC leg. When the CD leg completes near the Fibonacci extension levels, it suggests that the pattern is complete and a bullish reversal may occur. Traders often look for additional confirmation signals such as candlestick patterns, volume analysis, or other technical indicators before entering a trade based on the bullish Gartley pattern. As with any technical analysis tool, it's important to remember that the bullish Gartley pattern is not foolproof and should be used in conjunction with other analysis methods and risk management strategies.
B9A-88652-NisarAhmad
BTC/USDT

The Bearish Gartley pattern is a specific type of harmonic pattern used in technical analysis to identify potential reversals in financial markets. It was introduced by H.M. Gartley in his book "Profits in the Stock Market" in 1935. This pattern helps traders to predict the end of a corrective move against the main trend and signals a potential selling opportunity. Key Characteristics of the Bearish Gartley Pattern: Initial Move (XA): The price movement starts with a significant bullish move from point X to point A. Retracement (AB): The price then retraces from point A to point B, typically retracing 61.8% of the XA move. Extension (BC): Following the AB retracement, the price moves again in the direction of the initial XA move to point C, which is typically 38.2% to 88.6% of the AB move. Correction (CD): Finally, the price makes another move from point C to point D, which is an extension of 127.2% to 161.8% of the BC move. Point D is usually at the 78.6% retracement of the XA leg.
Disclaimer
Any content and materials included in Sahmeto's website and official communication channels are a compilation of personal opinions and analyses and are not binding. They do not constitute any recommendation for buying, selling, entering or exiting the stock market and cryptocurrency market. Also, all news and analyses included in the website and channels are merely republished information from official and unofficial domestic and foreign sources, and it is obvious that users of the said content are responsible for following up and ensuring the authenticity and accuracy of the materials. Therefore, while disclaiming responsibility, it is declared that the responsibility for any decision-making, action, and potential profit and loss in the capital market and cryptocurrency market lies with the trader.