
AspiringPro
@t_AspiringPro

What symbols does the trader recommend buying?
Purchase History
پیام های تریدر
Filter
AspiringPro
تحلیل شوکهکننده بازار: آیا روند صعودی تمام شده است؟ حرکت بعدی میو کجاست؟
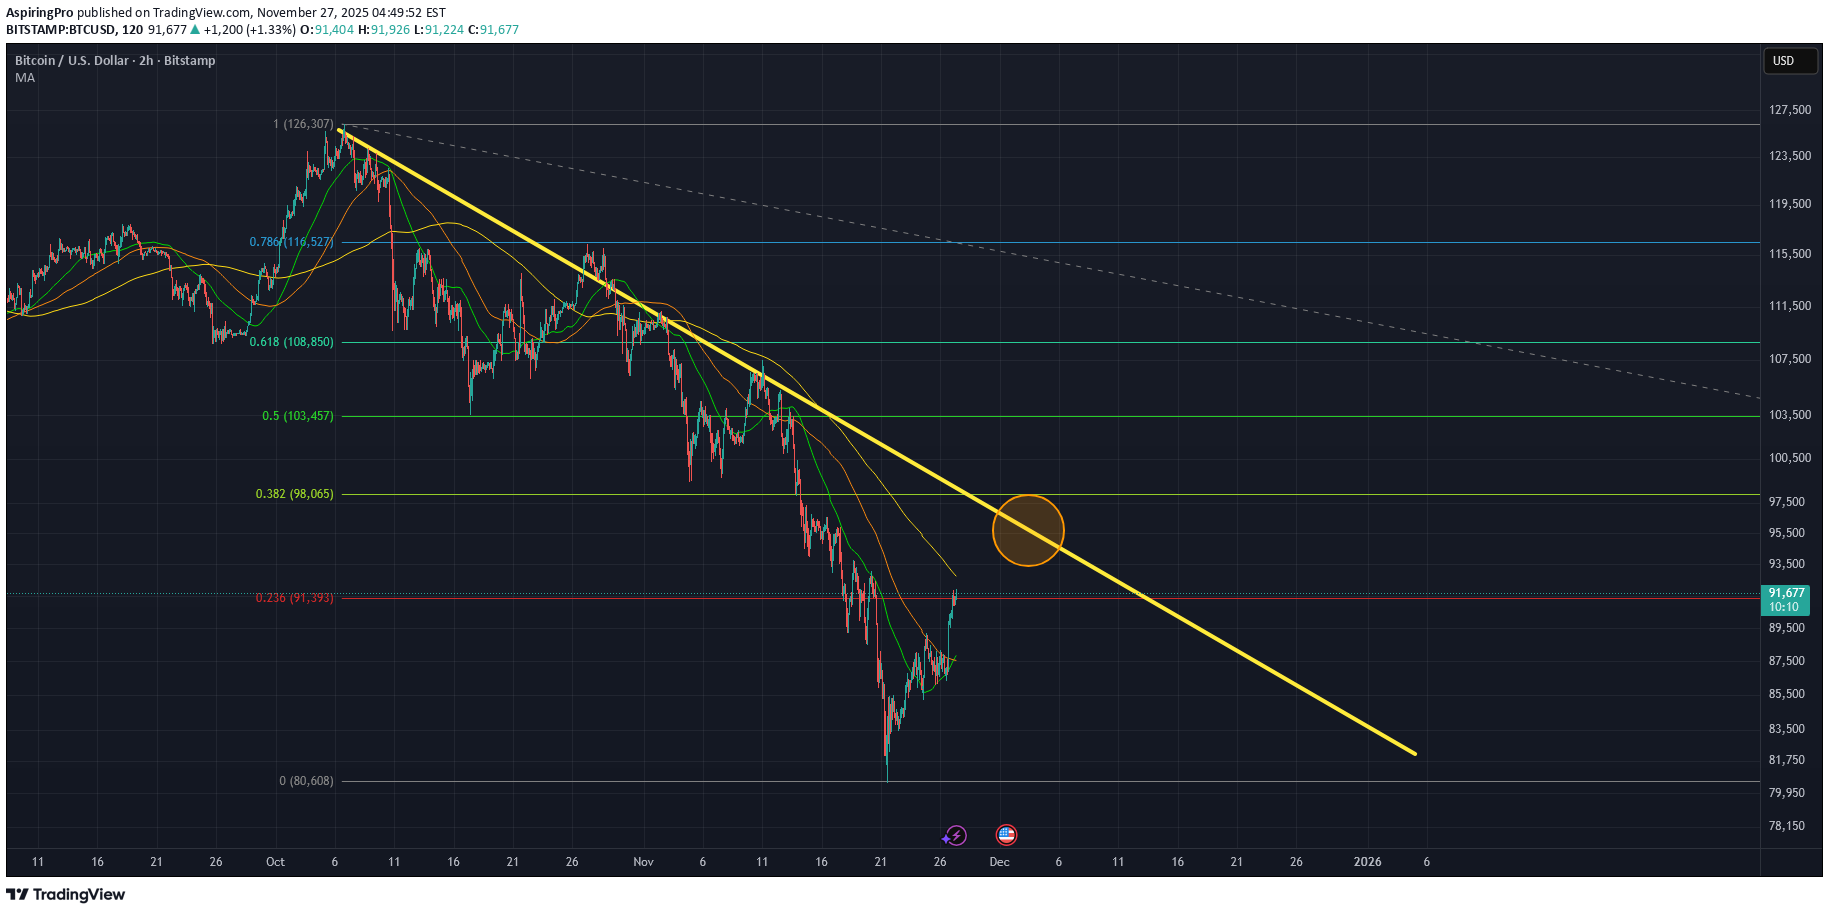
Depending on the buy-side volume, this can bounce to the yellow trendline, and potentially even wick to the 032 - 05 fibs. But, the reality is that this bull cycle is over and buy pressure on this bounce can dry up fast. Current battle at time of writing is the MA200 and 236 fib. If we can make it above that, maybe $94-$98k. Then, back down.
AspiringPro
سقوط بیت کوین تا کجا ادامه دارد؟ پیشبینی تاریخ و قیمت کف بازار
AspiringPro
Nasty

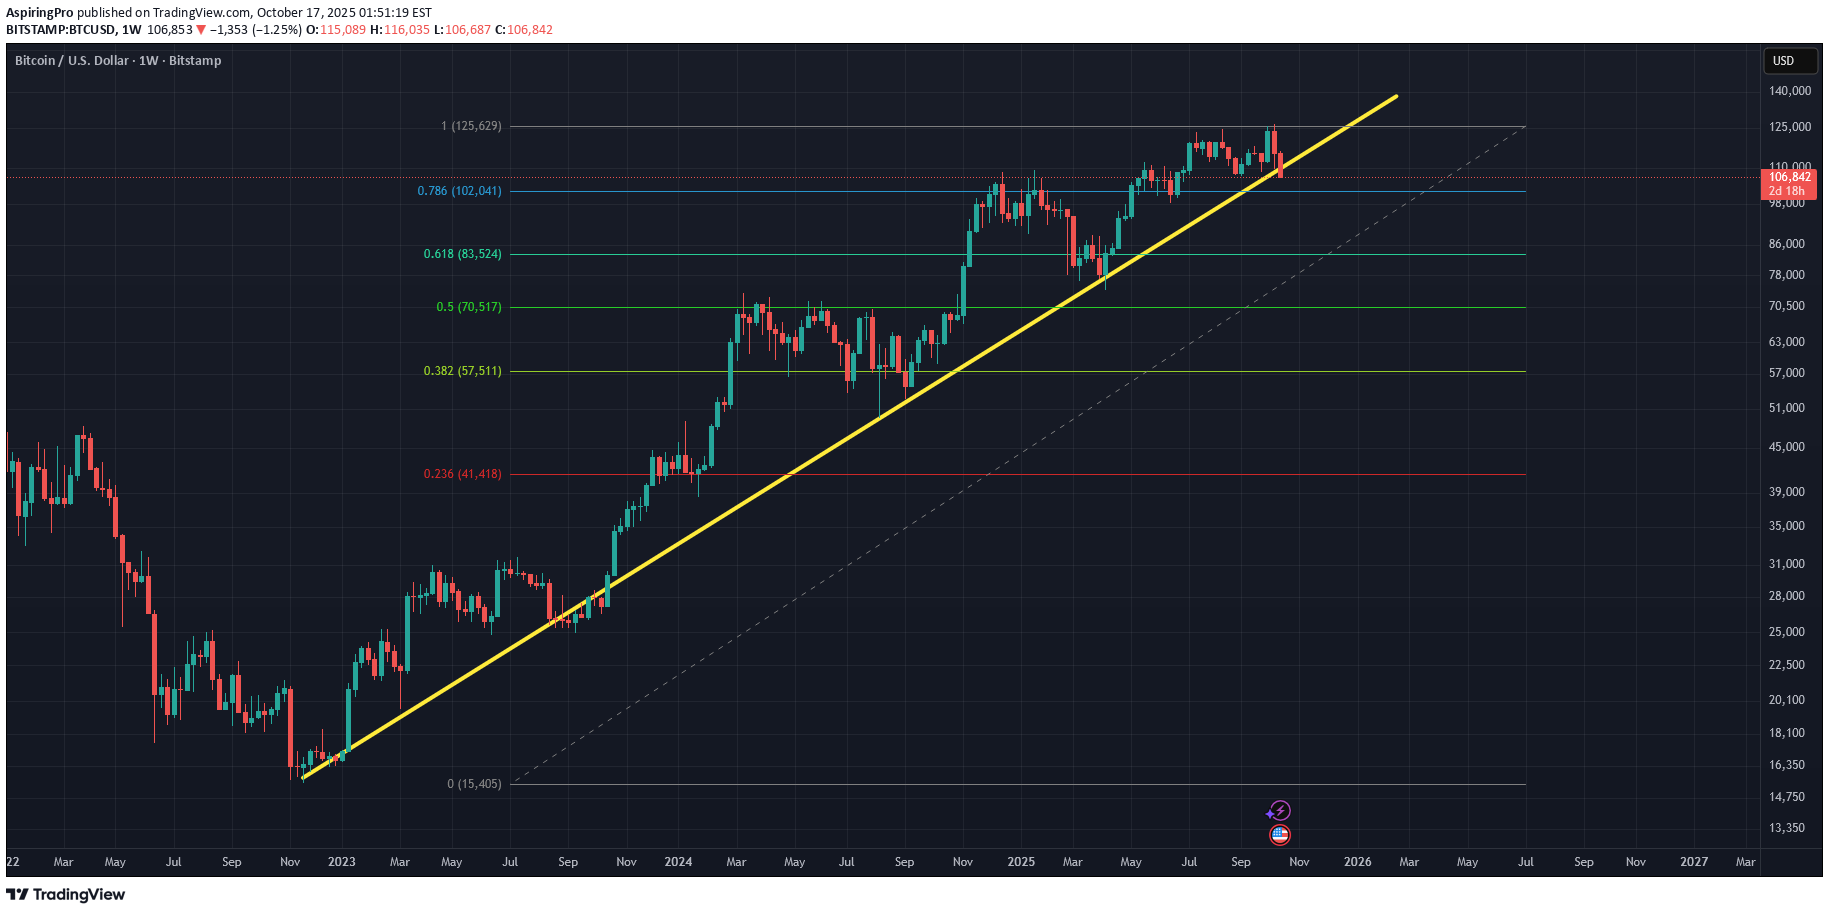
This bull cycle has had a very straight-forward trajectory, but this might be the end of the road.Well, thats a wrap for this bull run. Next stops 100k, 93k, 86k, 80k, 72k
AspiringPro
Final Push?
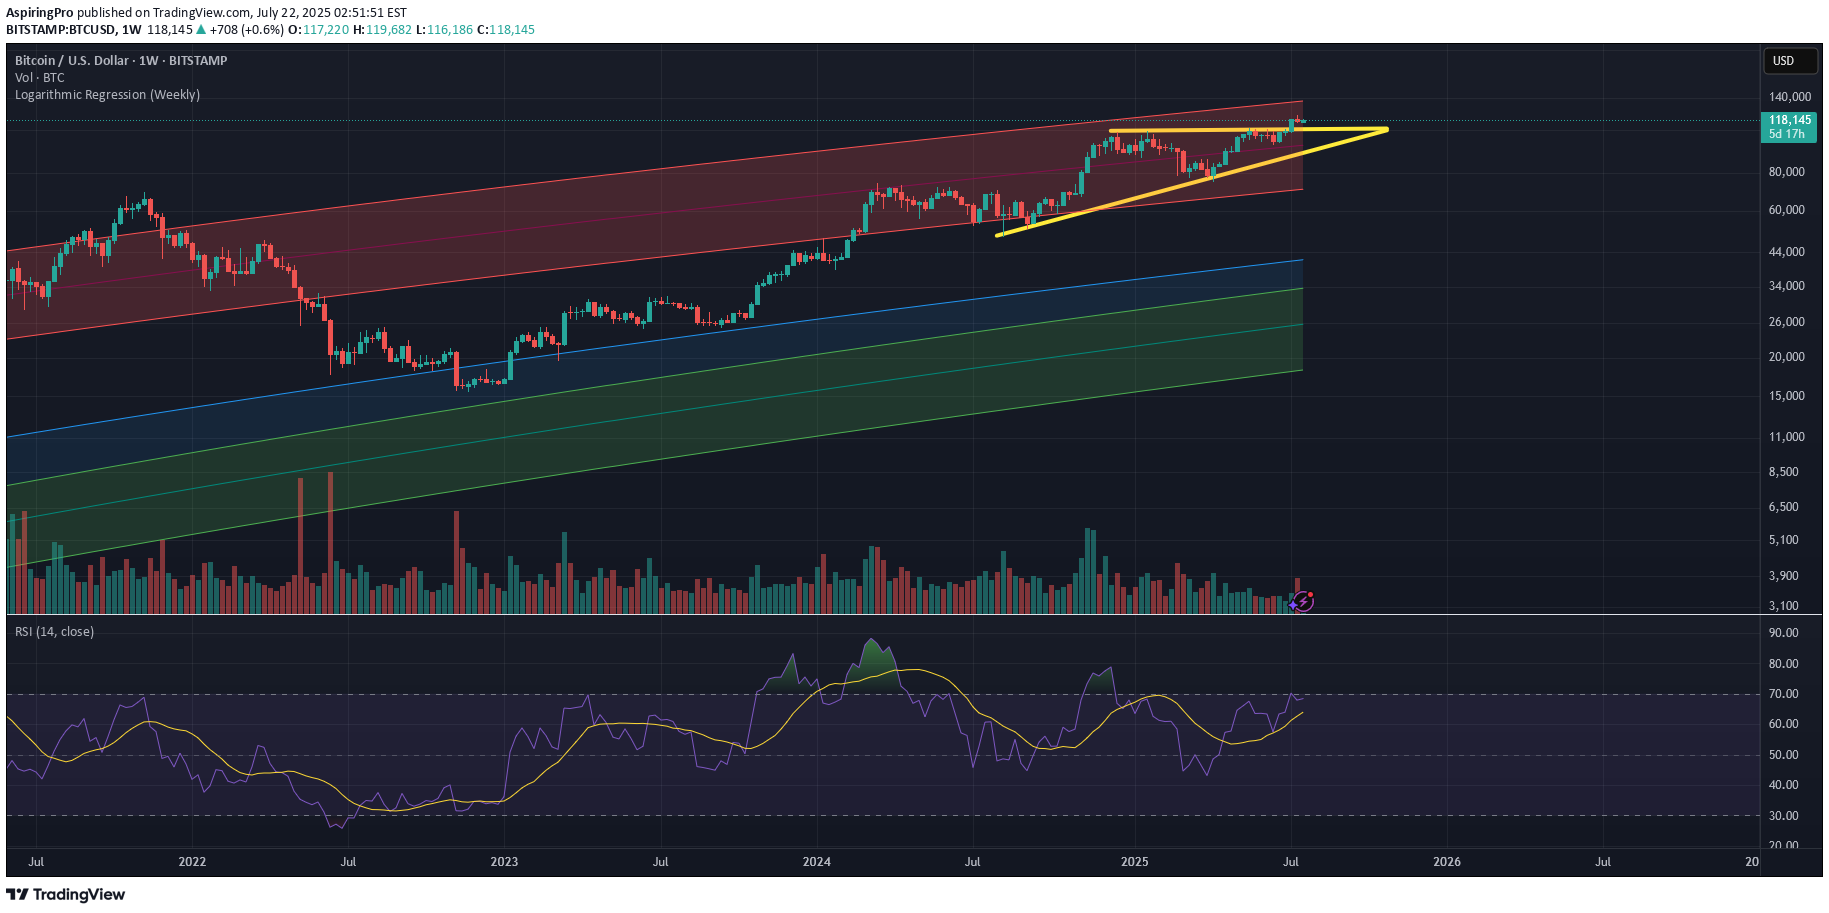
In a previous analysis I used the range of the yellow triangle as grounds for suspicion that the bull run may be over. Now, thankfully, it appears to have formed a support on top of this triangle, instead. I believe its possible for a big breakout here that will pop out of the red log zone, which would signal the top of this cycle/bubble. However, for this we will need lots of volume, for which we need lots of euphoria. $192,000 seems to be the target based on the target of the yellow triangle drawn, as well as the fib retrace. The fact that we are consolidating above $115,000 speaks to me that we still have plenty of juice, but moving the price at this market cap will require a lot of juice. Thus, I have ladder sells starting at $130,000Bitcoin always surprises us. Thus, I would not be surprised if we didn't even make it out of the red log channel, especially given how much time we have spent inside the red zone this cycle (obviously due to slower movements corresponding to the high marketcap). The cycle top this time could be a mere touch of the top of the red channel. That is why I will start scaling out at $130,000 - this is the area where price will touch the top of the red zone channel.This actually looks quite precarious. Might be a failed breakout. Could be the first bullrun to break the 5Y log regression chart
AspiringPro
major ouchie

US involvement in the middle east just might spell the end for the bull portion of this current halving cycle this structure is looking very precariousCrisis averted (????)Actually, given the way that we are resting atop the green triangle that I've drawn, a violent upward breakout here could correspond with the final mania leg of this halving cycle. In otherwords, this could be the last leg coming up this quarter. I'd like to start slowly scaling out at 130k.
AspiringPro
Blow off soon?

PSA this is just ripping off Peter Brandt's tweets. I gathered his breadcrumbs and pieced together this analysis. His most recent comment in April '25 suggested that the recent BTC pullback was a back-test of a long standing reverse H&S formation. He has not provided any charting of this formation afaik but I reverse engineered it and I believe this is the formation he is referring to. He has also said several times that he feels the peak will be in Sept '25 at around $140,000. Given this information, we have a rough roadmap of how we ought to get there. The market has cooled off since inauguration day and could be preparing for the blow off top. Fingers crossed!
AspiringPro
Bearish Thoughts

Looking at the log regression, it dawned on me that every time that BTC has come down to the bottom of the red channel, it usually didn't have the juice to pop back up. I think 33k might be in play, top of the blue channel. Alternatively, bouncing off here can save the bullrun. But in this global climate? I'm not so sure. Holding steady, but cash ready.A decisive close above 65,000-67,000 could trigger a strong breakout.Bearish scenario (thankfully) invalidated. Quite a strong triangle break, maybe we're off to 100k?
AspiringPro
Eyeballing the Cycle High

This all seems familiar to me... BTC has popped off from its cycle low and shown us market participants that it's alive, and now its consolidating around the previous cycle high. This log regression fits quite nicely over Bitcoins steady, exponential and almost linear rise. It would appear that BTC will break out of the regression channel at around $110.000-$120.000, at which point it would be time to start scaling out - hastily, though not all at once. This is my strategy, anyway. And, it will have to be adjusted along the way as it'll likely be front-ran by larger and more sophisticated investors, institutions, and governments.Decided to test my predictive power today - I'm calling a cycle top of +-$125,000, in '25Q2 - '25Q3. Firstly, according to classical charting, the cup and handle structure we just broke out of suggests this target ((71-16)+71)=126), where 16k is the cup bottom, and 71k is the rim. Secondly, the log regression red channel top reflects this as well. This channel is likely to rise given the nature of MA's, but as it stands now, 125k it is. BTC can blow past this target and move outside of the red channel like previous cycles, OR it can get front ran by the many powerful institutions that are now in crypto. There are a lot of nuances, but I think, on average, 125k is in play.
AspiringPro
Eyeballin'

I like coming back to the BTC 5Y every year or so to see how the chart has morphed. This will be the third BTC bull cycle for me, and it seems like there are always three major technical developments in the run-up ; 1) major triangle breakout 2) initial growth phase 3) parabolic growth phase The major triangle breakout signifies a departure from the price range of the previous ATH and relative crash low. The initial growth phase is self-explanatory, but the parabolic phase is marked by a steep increase in slope and that feeling of euphoria in the air amongst market participants. From triangle breakout to blow off top, it looks like the time-frame is about 12-15 months, give or take. Also important, the triangles are losing steepness over time, and as a result the % gains are diminishing. If the last peak-to-peak was around 360% (19k - 69k) , and before that 1,900% (1k - 19k), then I infer that this time we will see a growth rate of around 100%, probably less tbh. Therefore, I'm calling a maximum top of around $139,000 this cycle (69k*2), which should be reached around Nov 2024. Though, as we know, crypto markets are extraordinary speculative and emotional, and so this range is just an eyeball. Best of luck to everyone, lets get it.
AspiringPro
General Direction Overview

General Direction Overview Not meant as a serious analysis, just interested to see what trajectory BTC USD ultimately embarks upon. Will check back in a year or two. Due to fiscal irresponsibility from every world government, as well as changing global economic structure and geopolitical situation, it would be difficult to imagine a scenario where BTC breaks downward and dies.
Disclaimer
Any content and materials included in Sahmeto's website and official communication channels are a compilation of personal opinions and analyses and are not binding. They do not constitute any recommendation for buying, selling, entering or exiting the stock market and cryptocurrency market. Also, all news and analyses included in the website and channels are merely republished information from official and unofficial domestic and foreign sources, and it is obvious that users of the said content are responsible for following up and ensuring the authenticity and accuracy of the materials. Therefore, while disclaiming responsibility, it is declared that the responsibility for any decision-making, action, and potential profit and loss in the capital market and cryptocurrency market lies with the trader.