
AscensionTrading
@t_AscensionTrading

What symbols does the trader recommend buying?
Purchase History
پیام های تریدر
Filter
AscensionTrading
NVDA plan over the next few months

NVDA is one of the key players in the A.I. revolution, but it looks like it is going to get caught up in the macro news and the China trade war. The chart below is my general plan on NVDA going forward.
AscensionTrading
SPX Bear Bars

It has been awhile since I have put together a big bear chart. The weekly double top on SPY, head and shoulders on IWM, RSP and ARKK, and the carnage and weakness seen in IYT, XLF, XLU, XLP, XLRE, XLV and XLY has me thinking about bear scenarios. That does not even factor in the macro economic and geopolitical uncertainty on the horizon. As I said above, SPY has a pretty gnarly weekly double top showing up right now. A perfect weekly double top proceeded the 2022 crash and the 2008 crash. Double tops can certainly fail but I think for risk management purposes, this scenario should at least be on the table. Ever since the AI boom and the NVDA gap up on May 25th the crash set up seemed to be off the table for most. However one could argue it simply pushed it out in time and also made the severity less intense in total percentage terms. A similar chart pattern to what we are seeing currently is the 2000-2008 correction. If something like this plays out, we will likely make a new low in 2024, which would end somewhere in the $320-$280 area. Big tech is holding up the market and as long as the biggest 7 or 8 tech stocks in the world keep heading higher, this scenario will not happen. However, watch for weakness in key stocks that have been holding up this market such as NVDA and MSFT. When NVDA fills its earnings gap from May 25th and MSFT fills its gap from April 26th that will likely be when something like this can play out.
AscensionTrading
BTC, They Will Call Us Lucky

Long Term thoughts for BTC into 2024 and 2025. I was hoping for one more push into 20k before a larger breakout for some prime accumulation levels, but but this actually makes for a more bullish chart. This chart is a LOG chart and BTC never broke below that channel which is key. Picture perfect bounce of the lower trend line. This next wave should be aggressively bullish and not give the great dip buy opportunities that traders are wanting.It has certainly been aggressively bullish so far. Now the main indicator to watch for is distribution and retest of the mid 30k level or does it continue to go vertical. If it goes vertical from here, the top will likely be less high and come sooner than if it can base in the high 30k to low 40k level for some time and then break out and really pump post halving. Spot ETF is certainly going to play a big roll in how this plays out.This idea absolutely crushed! I think Target 3 remains valid as I am targeting $130-150k on a push higher from here.
AscensionTrading
Yup, another 2008 comparison chart
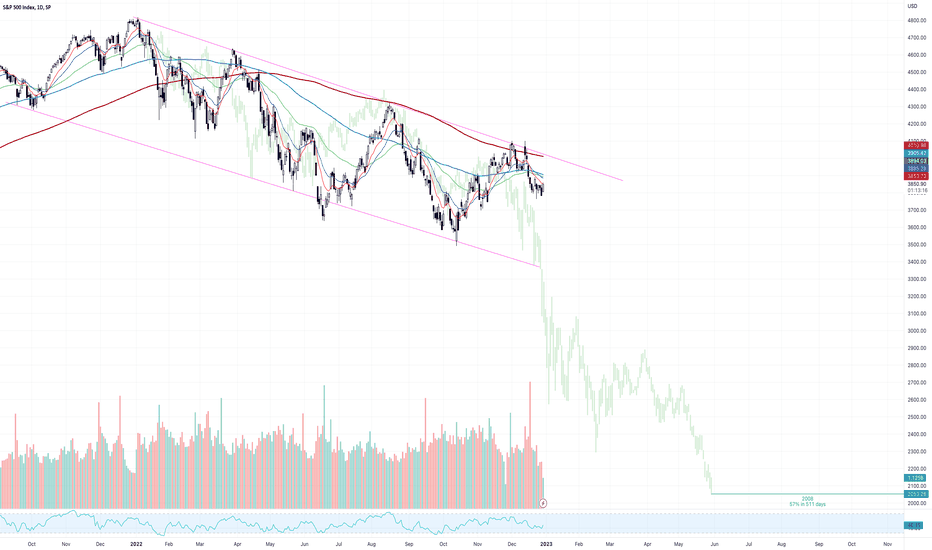
The green bar pattern is taken from the 2008 top to the 2008 bottom. The downturn took 511 days from top to bottom of the market and was a 57% downturn. We are have been tracking the 2008 price action extremely closely for about a year now. In 2008, at 358 days from the all time high, we broke to new lows and got a capitulation event that lasted another 100 or so days. The same thing doesn't have to play out again, but know that it is possible. It would also put the market bottom sometime next spring or summer, right in the middle of the predicted recession. Markets tend to bottom in the middle of recessions, so that also lines up very well. Let's see what plays out from here!
AscensionTrading
BTC pattern similarites

Lots of similarities in what is happening today with what the May crash and subsequent bottom.
Disclaimer
Any content and materials included in Sahmeto's website and official communication channels are a compilation of personal opinions and analyses and are not binding. They do not constitute any recommendation for buying, selling, entering or exiting the stock market and cryptocurrency market. Also, all news and analyses included in the website and channels are merely republished information from official and unofficial domestic and foreign sources, and it is obvious that users of the said content are responsible for following up and ensuring the authenticity and accuracy of the materials. Therefore, while disclaiming responsibility, it is declared that the responsibility for any decision-making, action, and potential profit and loss in the capital market and cryptocurrency market lies with the trader.