
AmirMIssa
@t_AmirMIssa

What symbols does the trader recommend buying?
Purchase History
پیام های تریدر
Filter
AmirMIssa
بیت کوین در آستانه جهش بزرگ؟ حمایت کلیدی کجاست و چه اتفاقی در راه است؟
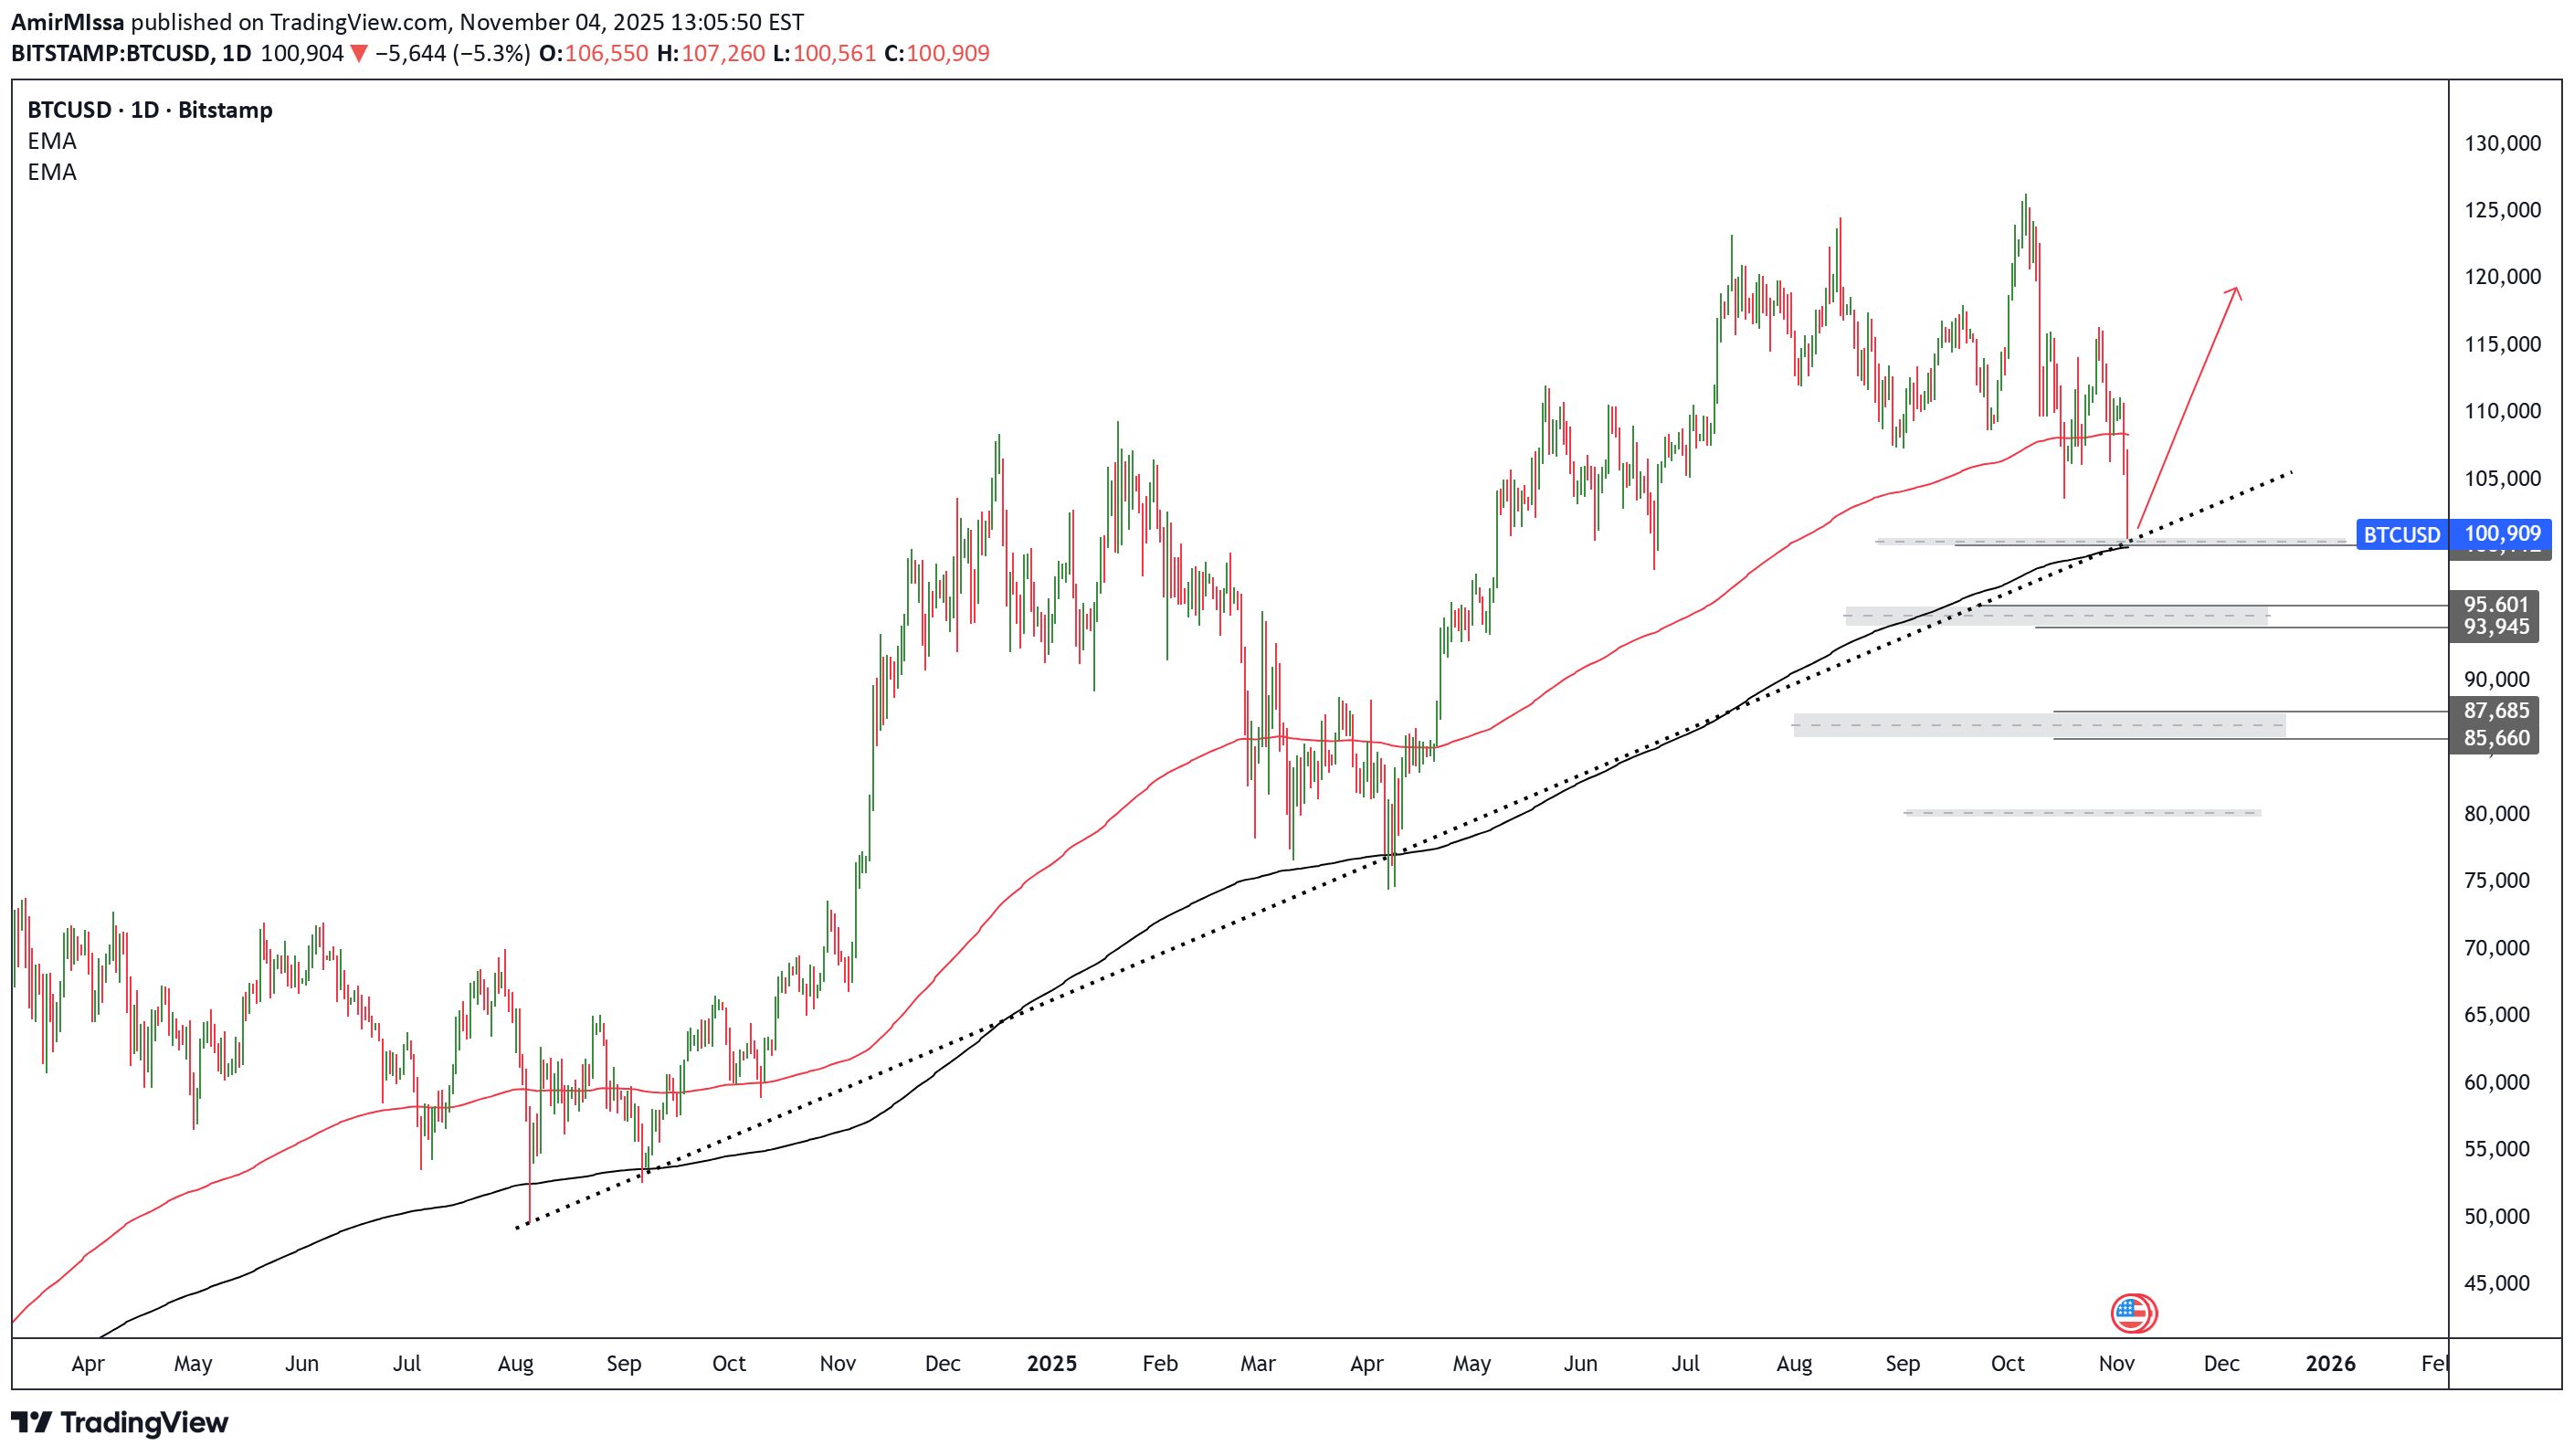
Bitcoin is undergoing a downward correction against its broader medium-term uptrend, with the latest corrective wave — which pushed the price down toward 101,043 — nearing its end. This level aligns with both the ascending trendline and the 365-day moving average, reinforcing the likelihood of a bullish rebound from this area. If the price manages to hold above this level, a new upward wave is expected to emerge, initially targeting the 108,000 zone, followed by 115,000 as the second objective. However, if the price breaks below the current trendline, a bearish scenario may unfold toward the demand zone between 95,600 and 93,900, which represents the next key support area. The positive outlook remains valid as long as the price stays above the black moving average, while a sustained daily close below it could lead to a deeper correction toward 87,600–85,600. Overall, the most likely expectation is a bullish rebound from current support levels, unless a clear break occurs below the main ascending trendline.
AmirMIssa
سیگنال هشدار طلا: الگوی گُوِه نزولی آماده ریزش است!
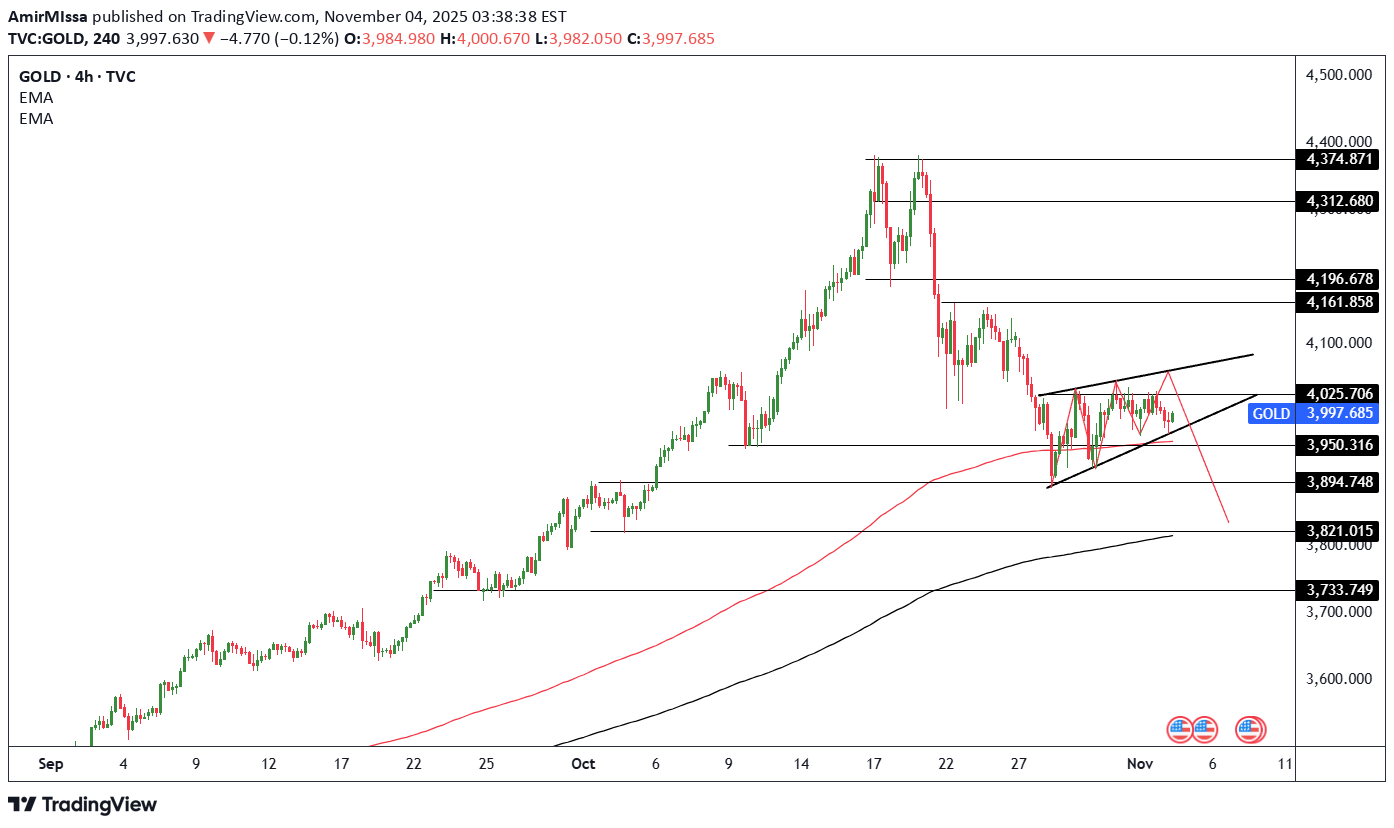
The four-hour chart of gold (XAU/USD) shows price action developing within a rising wedge pattern, which typically indicates a potential bearish reversal if a breakdown occurs. The price is currently hovering around $3,995, near the 50-period exponential moving average that acts as dynamic resistance, while the 200-period EMA below provides structural support for the broader trend. From a technical perspective, the bias remains bearish as long as the price stays below the upper boundary of the wedge and under the $4,060 resistance level. A confirmed break below the wedge’s lower trendline could trigger a decline toward $3,950 and $3,890, with further downside potential extending to $3,820 and $3,730. Conversely, a breakout above $4,025–$4,040 could lead to a temporary corrective rally toward $4,160 before sellers potentially regain control. Overall, gold maintains a downward bias in the short term, with momentum favoring further weakness unless the price stabilizes above $4,060.
AmirMIssa
معامله پرریسک طلا: آیا موج اصلاحی در راه است؟ (سیگنال خلاف روند)

The chart shows gold on the 15-minute timeframe completing a fifth bullish wave near 4130, suggesting a potential short-term corrective move forming an A-B-C pattern. The current setup is highly risky as it goes against the prevailing uptrend supported by the 50 and 200 EMAs. Any short positions here should be considered speculative, with a stop loss at 4133 and an initial target around 4047. A sustained move below 4100 would confirm the start of the anticipated correction.
AmirMIssa
Gold (XAU/USD) Technical Analysis – July 3, 2025

The chart of gold (XAU/USD) on the 15-minute timeframe shows that the price is moving within a corrective range after a strong bullish wave during which gold reached levels above $3,368 per ounce. Following a rejection from the resistance area near 3,365–3,368, the price began a downward correction and is currently stabilizing around the support zone at 3,344–3,343.The price is now testing a key support area. If it holds above this zone, we may see a rebound toward the 3,363 and 3,365 resistance levels. A breakout above 3,368 could restore bullish momentum and open the way for new highs.However, if the current support at 3,343 breaks, the bearish scenario would be favored, with potential targets at the next support levels around 3,336 and 3,329.Likely Scenario: As long as gold holds above 3,343, the bullish bias remains valid. We will monitor price action at this area to confirm a possible rebound.Key Levels to Watch:Support: 3,343 – 3,336 – 3,329Resistance: 3,363 – 3,365 – 3,368This is a short-term analysis and depends on the price reaction at the current support zone.
AmirMIssa
Gold declines amid global calm and progress in U.S.-China trade

🎯 Gold extended its losses following a two-day round of high-level negotiations in Geneva, where China and the United States announced a joint statement aiming to end the trade war between the two countries.🤝 Key points of the new agreement:▪️ China will reduce tariffs on U.S. imports from 125% to 10% for a period of 90 days▪️ The U.S. will apply a base tariff of 10% on Chinese goods, along with a 20% tariff on fentanyl▪️ Both parties will begin implementing the revised tariffs starting May 14At the same time, the progress in negotiations and easing tensions between India and Pakistan have reduced demand for gold as a safe haven, leading to a drop in its price early in the week.Gold now appears headed toward previous support levels at 3227 and possibly 3180.
AmirMIssa
Scalping Trade – Technical Analysis on Gold (1-Minute Timeframe)

In this brief analysis, we examine a scalping opportunity on Gold (XAU/USD) using the 1-minute chart, focusing on a short-term technical setup supported by both price action and indicators.The chart displays a well-defined downward trend, confirmed by two descending red trendlines. These trendlines have been respected consistently by the price, indicating a strong bearish structure. At the time of analysis, the price action approached a key resistance zone around the 3,319 level.This resistance is notable for two reasons: it represents a horizontal level tested multiple times, and it coincides with a descending trendline, forming a confluence that increases the probability of a price rejection. This dual-resistance scenario presents a compelling case for a short entry.A sell position was initiated near this resistance area. The stop loss is placed above the resistance zone, near 3,325, to protect against a breakout. The take profit is set around 3,301, targeting a recent support level established by a strong previous low. This provides a clean technical target within the current structure.Supporting this trade idea, both the MACD and Stochastic Oscillator are showing overbought signals and have begun turning downward, suggesting weakening bullish momentum and the potential for a bearish reversal.The trade offers a risk-to-reward ratio of approximately 1:1.97, which is considered favorable in scalping strategies, where precision and timing are critical.
AmirMIssa
Gold Short-Term Outlook: Potential Rebound Toward Resistance Be

The price is currently trading around the 3353 level, after bouncing from a key support zone at 3329 dollars.In the first scenario, if the price continues to rise, it’s expected to reach the 3398 level — a very strong resistance area, as it aligns with a descending trendline and multiple previous highs. This zone could trigger a strong pullback, and we expect a new decline back toward the 3329 and 3319 levels respectively. The MACD is giving a bullish signal, and the Stochastic is also moving up from the oversold area, which suggests the possibility of a temporary upward move.
AmirMIssa
Gold Hits Key Resistance – Will It Break Out or Pull Back?

Gold has been moving in a downtrend, and there's a clear descending trendline marked in red. The price has just reached that trendline right around the 3316 level, which also aligns with a horizontal resistance at 3329 — making this a very strong resistance zone. The price surged from the support area near 3224, breaking through minor resistances until it reached the current level. But what we need to keep an eye on is that momentum indicators like MACD and Stochastic below the chart are starting to show overbought signals, which could mean the price might pull back or at least slow down.🎯 Expected scenario now:If the price fails to break above 3329 and can't push through the trendline, we might see a corrective drop toward 3269, and possibly down to 3224 again.However, if the price breaks above this zone with strong volume and holds above it, we could see a continued bullish move toward 3352 — which looks like an ideal selling zone.
AmirMIssa
Gold Headed for Further Decline

Gold has broken out of a sideways trading range that lasted for about two weeks, between the resistance level at 3345 and the support level at 2275. Currently, gold is leaning toward a bearish outlook, targeting the 61.8% Fibonacci retracement level of the latest upward wave, which started in late November and peaked at $3500 earlier this month. The best selling opportunity for gold is around the 3238 level, with a stop loss at 3265 and a target at 3165.
Disclaimer
Any content and materials included in Sahmeto's website and official communication channels are a compilation of personal opinions and analyses and are not binding. They do not constitute any recommendation for buying, selling, entering or exiting the stock market and cryptocurrency market. Also, all news and analyses included in the website and channels are merely republished information from official and unofficial domestic and foreign sources, and it is obvious that users of the said content are responsible for following up and ensuring the authenticity and accuracy of the materials. Therefore, while disclaiming responsibility, it is declared that the responsibility for any decision-making, action, and potential profit and loss in the capital market and cryptocurrency market lies with the trader.