
Aluucard
@t_Aluucard

What symbols does the trader recommend buying?
Purchase History
پیام های تریدر
Filter
Aluucard
MOVE/USDT (4H Chart)
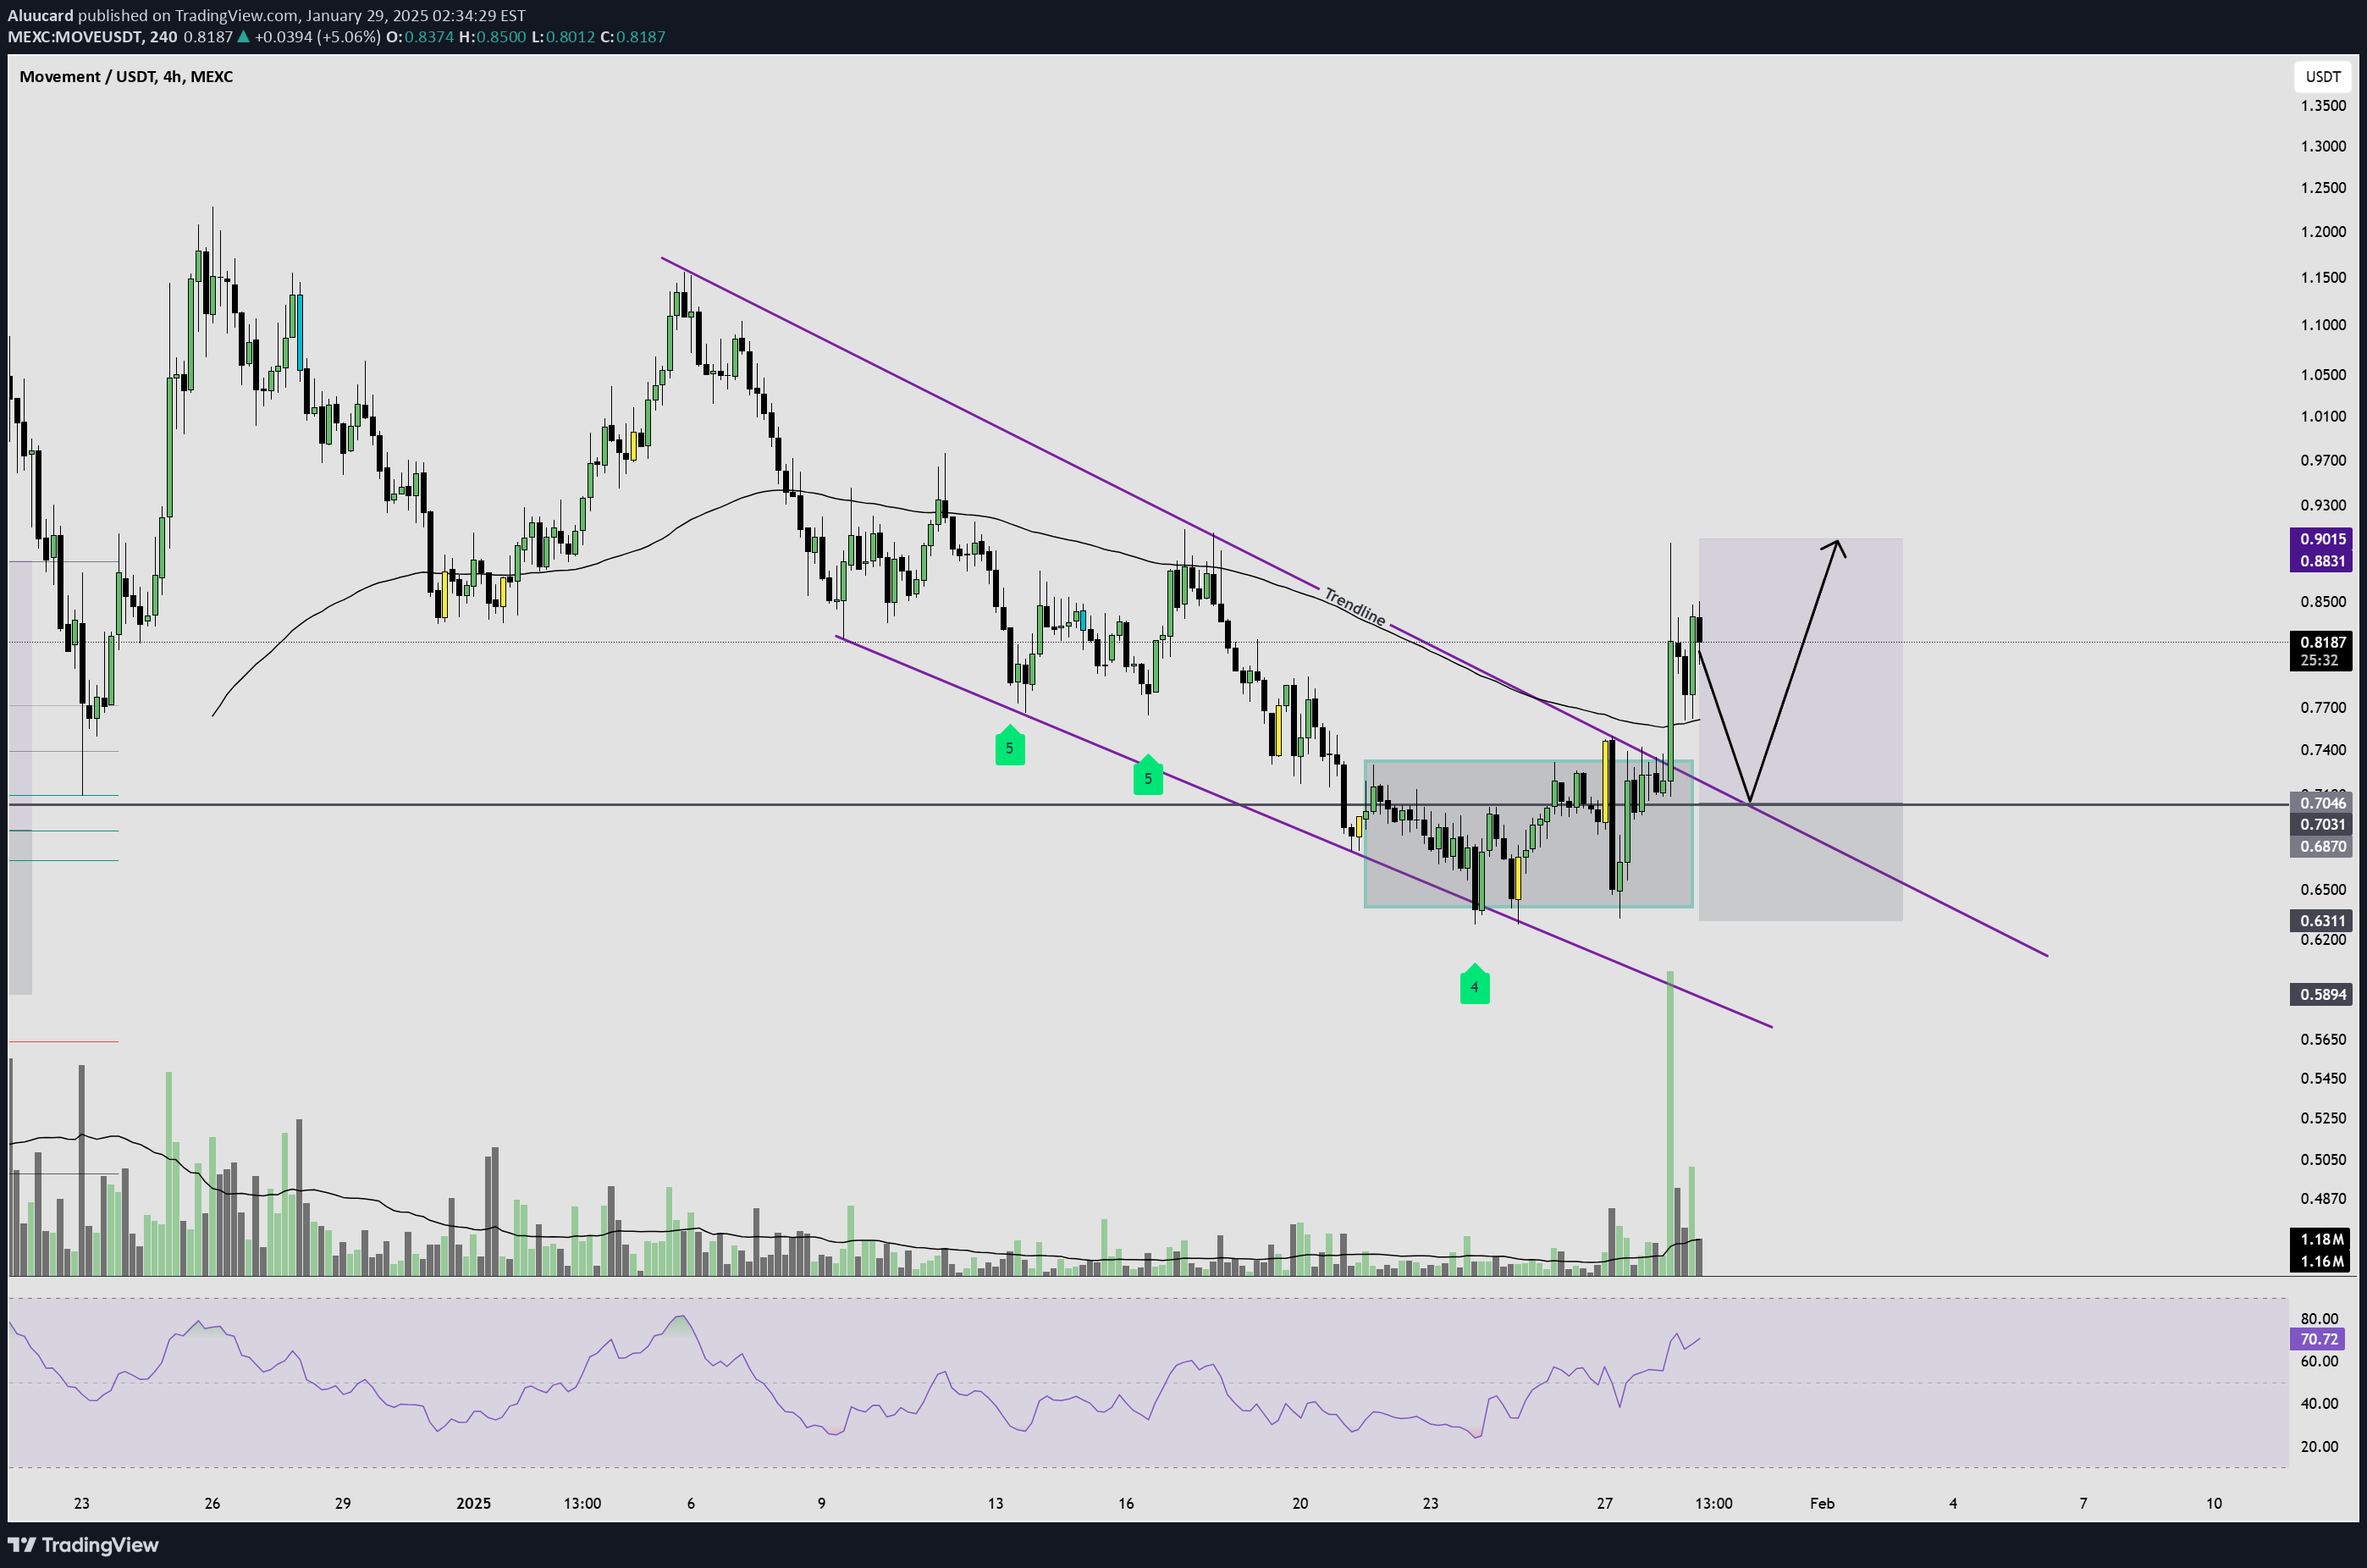
Trade Analysis & Setup: MOVE/USDT (4H Chart) Key Observations: Breakout from a Downtrend Channel 🚀 The price was in a descending channel, forming lower highs and lower lows. A strong breakout above the channel and trendline resistance has occurred. Volume spike supports the breakout, indicating strong buying pressure. Support and Resistance Levels: Support Zone: Around 0.67 - 0.70 USDT (previous resistance turned support). Next Resistance: 0.88 - 0.93 USDT (marked as a potential target zone). Retest & Confirmation Price is likely to retest the breakout zone (~0.70 - 0.74 USDT) before continuation. A successful retest with bullish confirmation would signal an entry opportunity. Volume & RSI: Volume Surge: Bullish confirmation of breakout. RSI Rising: Approaching overbought but still has room for continuation. Trade Setup: 📈 Long (Buy) Setup: Entry: $0.72 - $0.75 (on retest of the breakout) Stop Loss: Below $0.67 (to invalidate breakout) Take Profit Targets: TP1: $0.83 (previous resistance) TP2: $0.90 - $0.93 (major resistance area) 📉 Bearish Scenario (Invalidation): If price falls back into the channel and closes below $0.67, the breakout would be invalid. Potential drop towards $0.59 - $0.63 if the retest fails. Final Thoughts: ✅ Bullish breakout confirmed with strong volume and trendline break. ⏳ Waiting for retest around $0.72 - $0.74 for an optimal long entry. 🚨 Risk Management: Place stop-loss below $0.67 to avoid fakeouts. Would you like me to format this into a social media-ready post with hashtags? 📢🚀
Aluucard
DYDX Breaking out 4H

1. Falling Channel Pattern: The chart shows a falling channel, which is characterized by a series of lower highs and lower lows. This pattern is often seen as a bullish reversal setup when the price breaks out to the upside. The price has broken above the upper boundary of the channel, signaling a potential bullish breakout. 2. Breakout Confirmation: The breakout is marked clearly near 0.997 USDT, where the price is currently attempting to hold above the resistance level of the channel. If the price holds above this level, it could trigger a strong upward movement towards higher resistance levels. 3. Key Levels: Resistance: The immediate resistance level after the breakout appears to be 1.200 USDT, followed by a more significant resistance level at 1.240 USDT. These are likely profit-taking zones or areas where the price could face selling pressure. Support: The breakout level of 0.997 USDT should now act as support. If the price fails to hold above this level, the breakout could fail, leading to a possible retest of the lower channel. 4. Momentum Indicator: The momentum indicator (likely MACD or a histogram) at the bottom shows a bullish crossover with the green bars starting to build up. This supports the strength of the breakout and indicates growing buying pressure. 5. Target Areas: If the price continues to move upward after the breakout, the next target would likely be the 1.200 to 1.240 USDT range. This aligns with previous highs and could serve as a strong resistance zone. The measured move for the breakout could also project a move toward the top of the channel, which is aligned with the 1.200 USDT target zone. 6. Trade Setup: For a long position, entering at the breakout level (0.997 USDT) with a stop loss below the breakout zone (around 0.950 USDT) could be a good strategy. Profit targets: First target around 1.200 USDT, and then if the momentum remains strong, the next target would be 1.240 USDT. Conclusion: The chart signals a bullish breakout from a falling channel, and the momentum indicator supports the move. As long as the price holds above the breakout level at 0.997 USDT, the next targets would likely be 1.200 to 1.240 USDT. Keep an eye on price action near these resistance levels to determine whether the breakout will lead to further upside.
Aluucard
TON USDT IF BRAKE OUT

1. Symmetrical Triangle Pattern: The chart shows a symmetrical triangle pattern, which typically forms as a result of market indecision. The price is converging between two trendlines, indicating that a breakout is imminent. This type of pattern can break in either direction, but since it’s forming after a prior uptrend, it often signals a continuation to the upside (bullish bias). 2. Potential Breakout: The upper resistance line of the triangle is critical. A breakout above this resistance could lead to a strong upward move. The projected breakout target is marked on the chart around 6.0083 USDT. This is about 8.15% from the current price, indicating a good risk/reward ratio for the trade. 3. Key Levels: Support: The lower white line of the triangle provides immediate support. The Stop Loss (SL) is positioned near 5.3135, below this support, to protect against a downside move. Resistance: The upper white line is the resistance level. A break above this level would confirm the triangle breakout and could lead to the target of 6.0083. 4. Risk/Reward Setup: The setup shows a balanced risk/reward ratio. If the price breaks out upwards, the reward is significantly higher than the risk. The risk is clearly defined by the stop-loss at 5.3135, while the reward is aiming for a higher level near 6.0083 USDT. 5. Momentum Indicator: At the bottom, the momentum indicator (likely MACD or a histogram) shows some neutral momentum with slight bearish moves recently, which may reflect the consolidation. However, if the price starts to move upwards, the indicator should turn more positive, confirming the bullish breakout. 6. Conclusion: This symmetrical triangle offers a good potential trade setup. Watch for a breakout above the triangle resistance, which could lead to a continuation towards 6.0083 USDT. If the price fails to break out and falls below 5.3135, the trade will likely be invalidated, triggering the stop-loss. DYOR
Aluucard
SUSHI USDT

Trend: The chart shows a potential descending triangle or wedge pattern, with a breakout nearing the apex. SUSHI appears to be testing the upper boundary of the downtrend. Support and Resistance: Support: Around $0.52 (bottom boundary of the triangle and recent lows). Resistance: Around $0.63 (the trendline acting as resistance for the breakout). Indicators: The volume is slightly increasing as the price nears a breakout, which suggests a higher probability of a significant move once the resistance is broken. Trading Strategy Buy Position (on breakout) Entry Point: $0.63 (upon confirmed breakout above the resistance line). Stop-Loss (SL): $0.52 (below the recent low and triangle support to manage downside risk). Take-Profit (TP): First Target: $0.77 (first resistance after breakout). Second Target: $1.22 (further upside if the trend reversal strengthens). Risk Management Position Size: As always, ensure your position size aligns with your risk tolerance and capital. Adjustments: If SUSHI breaks below the support of $0.52, it would be prudent to reconsider the position as it could indicate a continued downtrend.
Aluucard
SEI/USDT Weekly Analysis: Long-Term Reversal Opportunity

In this weekly analysis of SEI/USDT, we observe a potential long-term reversal setup as the price tests a critical support zone. This level coincides with key Fibonacci retracement levels, suggesting that a bullish reversal could be on the horizon. The chart presents an attractive risk-to-reward ratio for traders looking to capitalize on a potential move back towards previous highs. Key Observations: Fibonacci Retracement: The price has retraced to the 61.8% Fibonacci level, a key zone often associated with strong support and potential reversals. This level is around $0.2454, which has shown to be a significant area of interest. Descending Wedge: The price action has formed a descending wedge pattern, which is generally considered a bullish reversal pattern. A breakout from this wedge could indicate the start of a new uptrend. Support and Resistance Levels: The immediate support is at the current price level around $0.2454, with major resistance levels identified at $0.9778 and $3.3109. A break above these resistance levels could open the door to much higher targets. Potential Targets: If the price successfully breaks out of the wedge and confirms a reversal, the first major target is around $0.9778, a 288.94% move from the current level. A more aggressive target lies around $3.3109, with an ultimate long-term target of $6.3638, representing a potential 1,196.33% gain. Volume: The volume has been gradually increasing as the price approaches the support level, suggesting growing interest and potential accumulation at these levels. ADX & DI Indicators: The ADX is showing a weakening of the bearish trend, with the potential for a bullish crossover in the DI lines. This would further support the case for a reversal in the coming weeks. Potential Trade Setup: Entry: Consider entering a long position near the current support level around $0.2454. Stop Loss: A tight stop loss can be placed just below the recent lows at $0.2160 to manage risk. Take Profit: The first target is $0.9778, with a potential to ride the trend further up to $3.3109 and even $6.3638 for more aggressive traders. Risk Management: This trade setup offers an excellent risk-to-reward ratio, but it is important to manage risk carefully. A close below $0.2160 could invalidate the setup, indicating that the bearish trend may continue. Conclusion: SEI/USDT is showing signs of a potential bullish reversal from a key Fibonacci support level. The combination of a descending wedge pattern, increasing volume, and weakening bearish momentum makes this an intriguing setup for traders. With the possibility of significant upside, this is a trade idea that could offer substantial rewards if the technicals play out as expected.
Aluucard
BTC/USDT Weekly Analysis: Critical Channel Resistance Test
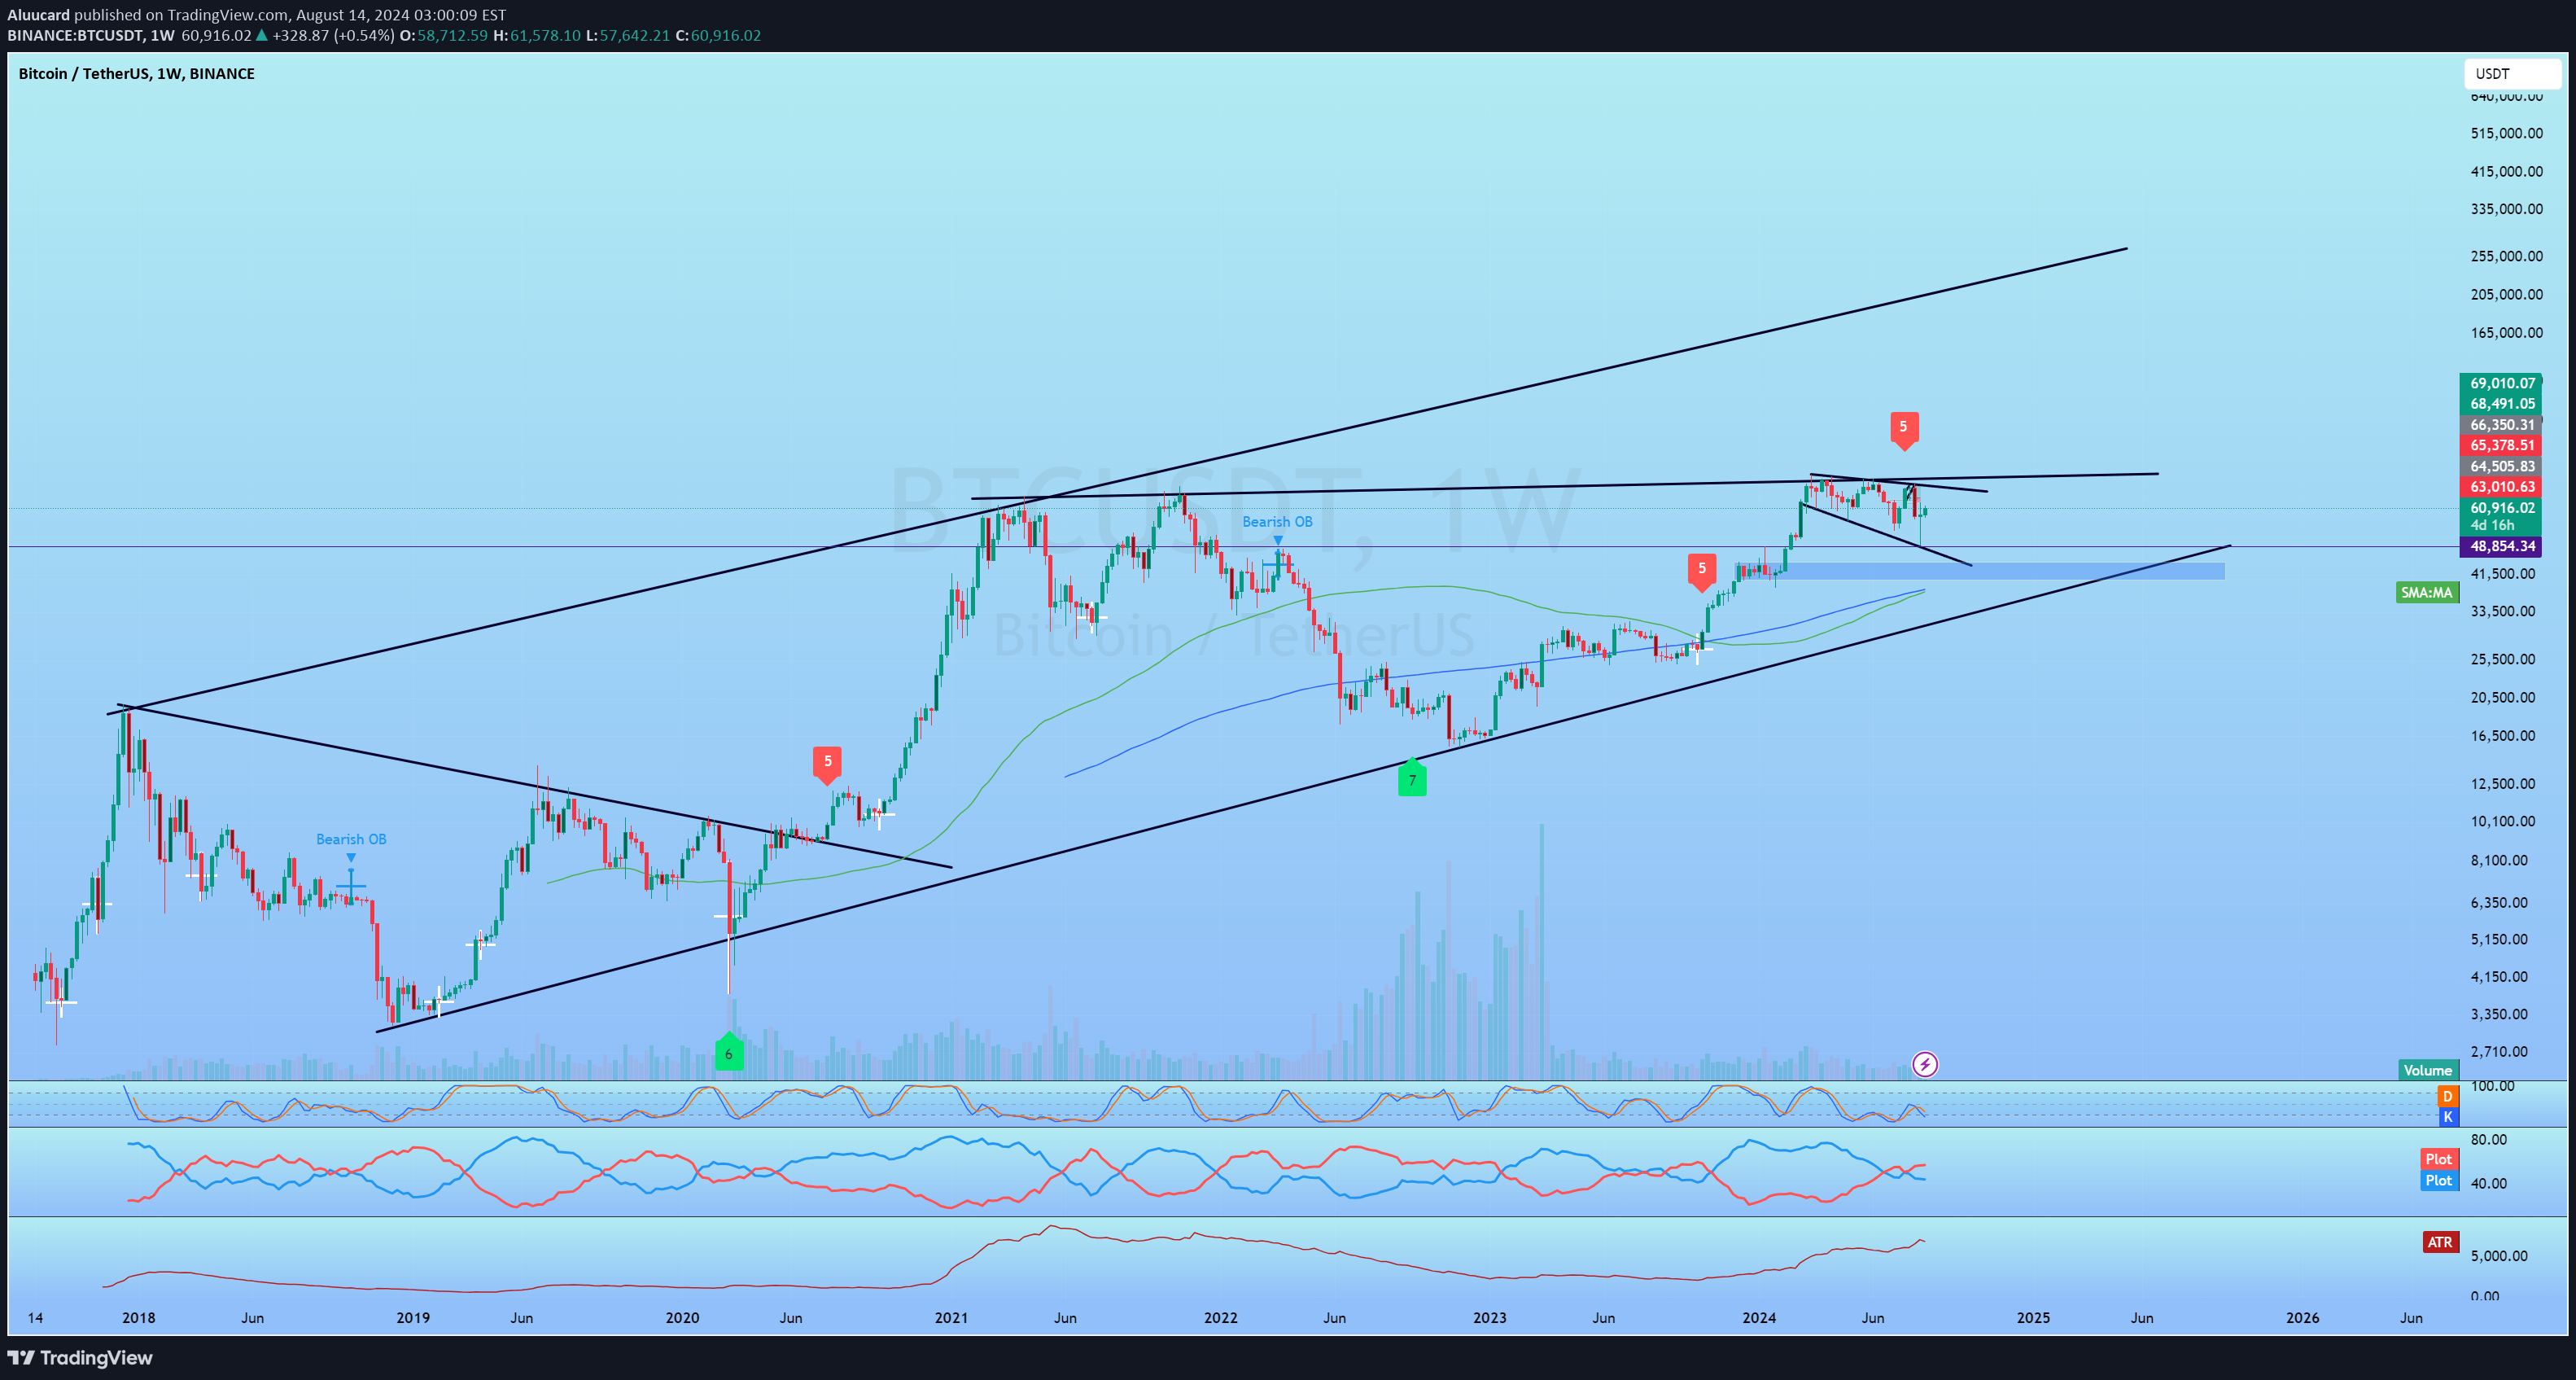
Timeframe: 1W (Weekly) Summary: In this weekly analysis of BTC/USDT, we observe Bitcoin testing a critical resistance zone within a long-term ascending channel. This is a pivotal moment, as a breakout above this resistance could signal the continuation of the bullish trend, while a rejection might lead to a significant correction. Key Observations: Ascending Channel: Bitcoin has been trading within a broad ascending channel since late 2018. The price is currently approaching the upper boundary of this channel, a level that has historically served as a strong resistance zone. Bearish Order Blocks (OB): A bearish order block is noted around the $64,505 to $69,010 range, which aligns closely with the upper boundary of the channel. This confluence of resistance increases the likelihood of a significant reaction at these levels. Stochastic RSI: The stochastic RSI is showing overbought conditions, which often precedes a pullback or correction. However, in strong bullish trends, the stochastic RSI can remain overbought for extended periods, so this should be interpreted with caution. ADX & DI Indicators: The ADX is indicating strong trend momentum, but the DI lines are showing potential for a bearish crossover. This could suggest a weakening of the bullish trend if confirmed in the coming weeks. Support and Resistance Levels: The immediate resistance is around the $64,505 to $69,010 level, where the price is currently testing. On the downside, key support lies around $48,854, which coincides with the middle of the channel and the 200-week SMA. Volume: The volume has been gradually increasing as the price approaches the resistance zone, which could indicate heightened interest in this level. A breakout with strong volume could be a bullish confirmation, while a rejection with high volume could lead to a deeper correction. Potential Trade Setup: Bullish Scenario: If Bitcoin breaks above the $69,010 resistance level with strong volume, a long position could be considered. The next major target would be the psychological $100,000 level, with stops placed just below the breakout point to manage risk. Bearish Scenario: On the other hand, if Bitcoin fails to break the resistance and shows signs of reversal, a short position could be considered with targets around $48,854 and lower, depending on the strength of the pullback. Risk Management: Given the current proximity to a major resistance level, traders should exercise caution. A confirmed breakout or rejection will be crucial in determining the next significant move. Proper risk management, including tight stop losses and position sizing, is essential in these market conditions. Conclusion: BTC/USDT is at a critical juncture as it tests the upper boundary of a long-term ascending channel. Traders should watch closely for signs of a breakout or rejection at this level, as it will likely set the tone for Bitcoin's next major move. The risk-to-reward ratio is potentially high, but so is the volatility, making this a crucial point for decision-making.
Aluucard
MDT/USDT Long-Term Channel Support Rebound

imeframe: 1W (Weekly) Summary: In this weekly analysis of MDT/USDT, we observe that the price action is currently testing a long-term ascending channel's support line. This setup suggests a potential bullish reversal or continuation within the channel, offering an attractive risk-to-reward opportunity for long-term traders. Key Observations: Ascending Channel: MDT/USDT has been trading within a well-defined ascending channel since mid-2020. The price has consistently respected both the upper and lower boundaries of this channel, and the current price action is once again testing the lower boundary, which historically has been a strong support level. Bearish Order Blocks (OB): Several bearish order blocks are marked on the chart, highlighting areas of potential resistance. However, these order blocks are well within the channel, suggesting that if the price rebounds from the current support, it could move towards testing these resistance levels. Stochastic RSI: The stochastic RSI is currently in the oversold region, which often signals that a reversal could be imminent. This aligns with the price testing the lower boundary of the channel, further supporting the bullish case. ADX & DI Indicators: The ADX indicates a weakening of the previous downtrend, with the DI lines potentially preparing for a bullish crossover. This adds another layer of confluence to the idea of a rebound from the current levels. Support and Resistance Levels: The immediate support is located around the $0.03443 level, which coincides with the channel support. Key resistance levels to watch are at $0.09757 and $0.14809, where the bearish OBs are situated. Volume: The volume has been relatively low during the recent downtrend, suggesting a lack of strong selling pressure. An increase in volume upon reaching the support level could confirm a strong reversal. Potential Trade Setup: Entry: Consider entering a long position near the current channel support around $0.03443. Stop Loss: A conservative stop loss can be placed just below the channel support, around $0.02755, to manage downside risk. Take Profit: Potential targets include the midline of the channel around $0.09757 and the upper boundary of the channel near $0.14809. Risk Management: Given that the price is at a critical support level, the risk-to-reward ratio is favorable for a long trade. However, if the price breaks below the channel support, it could indicate a shift in the long-term trend, and traders should be prepared to exit their positions if this occurs. Conclusion: MDT/USDT is presenting a compelling long-term trade opportunity as it tests the support of a well-established ascending channel. With several technical indicators pointing to a potential rebound, this could be a good entry point for traders looking to capitalize on a move back towards the channel's upper boundary.30% profit
Aluucard

Aluucard
VRA USDT

VRA has a good potential to pump soon, beware that 4x profit is for bull run not now but i can imagine some short profit around 50%
Aluucard
GLMR

GLMR has a head and shoulder pattern, it could give us 250% profit from here! DYOR
Disclaimer
Any content and materials included in Sahmeto's website and official communication channels are a compilation of personal opinions and analyses and are not binding. They do not constitute any recommendation for buying, selling, entering or exiting the stock market and cryptocurrency market. Also, all news and analyses included in the website and channels are merely republished information from official and unofficial domestic and foreign sources, and it is obvious that users of the said content are responsible for following up and ensuring the authenticity and accuracy of the materials. Therefore, while disclaiming responsibility, it is declared that the responsibility for any decision-making, action, and potential profit and loss in the capital market and cryptocurrency market lies with the trader.