
AliBahaari
@t_AliBahaari

What symbols does the trader recommend buying?
Purchase History
پیام های تریدر
Filter
AliBahaari
BTC keeps collapsing

📝💰 Due to the chart, BTC would form three probable patterns: 1. Running Flat 2. Running Triangle 3. Expanded Flat The PRZ zone is the area I've specified by using Fibonacci. So collapsing is certain, but... Running flat and expanded flat have impulse formation but running triangle not (A-B-C formation). Since wave 4 is often a triangle, so A-B-C is more probable. I've also used Ichimoku. A long flat Senkou Span B along with a thick cloud, it's informing us this topic which I can't pass it nowadays. Thus I think it would form wave B which is a upward wave and finally wave C would be formed by passing the cloud and more collapsing is on the way. 💣 In conclusion, I can say just be patience and ready for short positions. 🌐 My website: alibahaari.github.io
AliBahaari
AliBahaari
BTC will dive?!

As you see the chart above, I think there is 2 other scenarios which tell us: 1. I want to form an "expanded flat" pattern 2. I can be a "running triangle" pattern too So due to the scenarios above, a huge bearish wave would be appear on the chart. Be careful!
AliBahaari
BTC pattern is being extended

As you see the chart above, BTC chart pattern is a zigzag which is being extended as wave C of an A-B-C. I think it would change its route and begin downward trend in the zone I've specified.
AliBahaari
BTC can have downward movement

As you see the chart above, I think BTC is forming a expanded flat. So in this range, it can terminate its upward movement.
AliBahaari
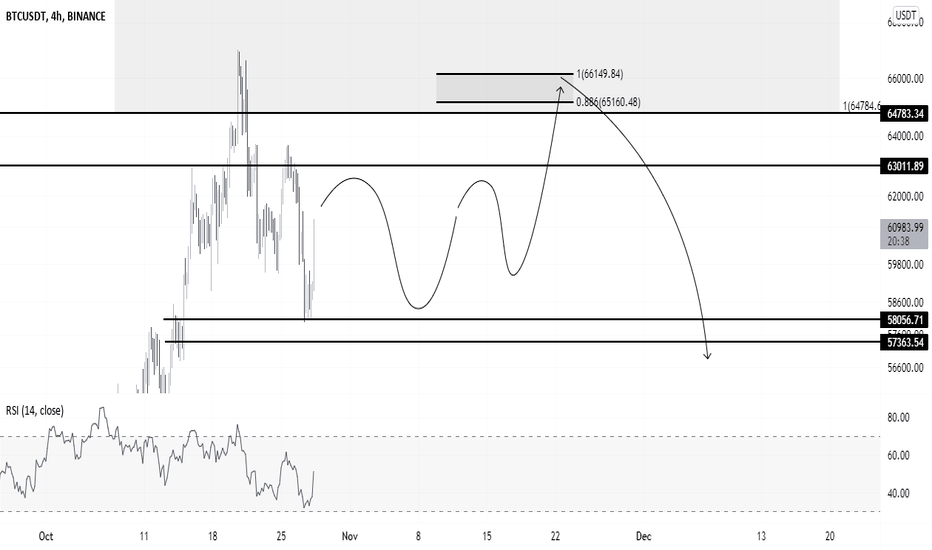
BTC is creating a bearish pattern!

If you've followed me, my previous analysis on BTC was correct and an upward movement called wave X happened. The wave X generally is formed by an A-B-C pattern and now it's within wave C and sometimes wave C is formed by a pattern called ending diagonal. So based on previous analysis and current status of BTC chart, I think after 2 downward and upward waves, next portion of the correction will be begun soon. Be careful!
AliBahaari
BTC is going to form a sideways
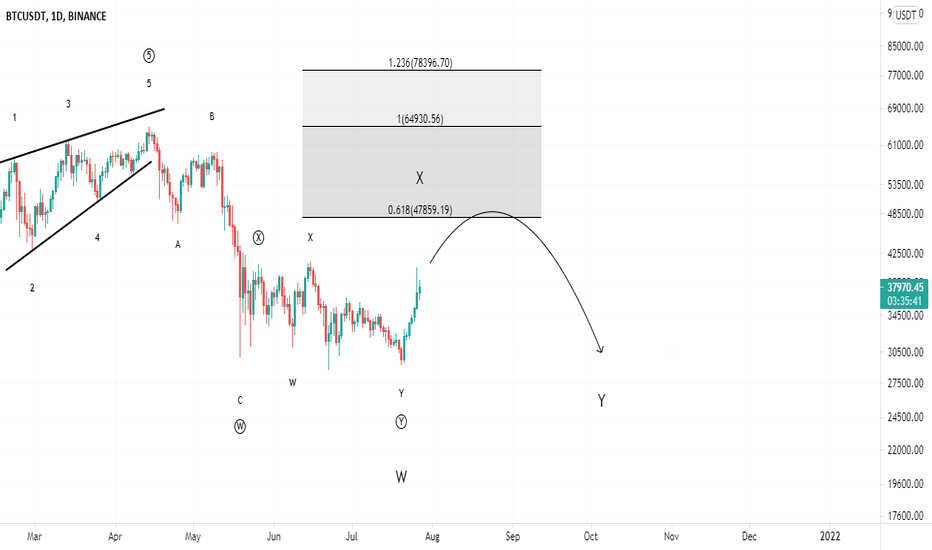
As you see the chart above, due to absurd upward movement of BTC, I think this correction is a complex one and the upward movement is a X wave. So I think by considering Fibonacci ratios and probable reverse zone, it can return from the zone I've specified. It probably forms a triangle in the wave Y but we must watch it at least for now.
AliBahaari
BTC will run away soon!

If you've checked my profile, it's forming the triangle I said. There are two little upward and downward movements in the triangle for wave D and E. After completing the triangle, it begins the main upward movement. So stay tuned!
AliBahaari
Another scenario for BTC but an upward!

I've posted the collapsing scenario and its probable route. But this one is different. Due to the chart above and sideways trend BTC has formed, I think this one is powerful too and after triangle portion completion it makes a upward movement. Stay tuned!
AliBahaari
BTC is resting for collapsing!

Due to my latest analysis about BTC, now I think it's within wave 2 of wave 3 from a larger degree. So it collapses again!
Disclaimer
Any content and materials included in Sahmeto's website and official communication channels are a compilation of personal opinions and analyses and are not binding. They do not constitute any recommendation for buying, selling, entering or exiting the stock market and cryptocurrency market. Also, all news and analyses included in the website and channels are merely republished information from official and unofficial domestic and foreign sources, and it is obvious that users of the said content are responsible for following up and ensuring the authenticity and accuracy of the materials. Therefore, while disclaiming responsibility, it is declared that the responsibility for any decision-making, action, and potential profit and loss in the capital market and cryptocurrency market lies with the trader.