
Algo_Trading_Mql5
@t_Algo_Trading_Mql5

What symbols does the trader recommend buying?
Purchase History
پیام های تریدر
Filter
Algo_Trading_Mql5
پیشبینی انفجاری اتریوم (ETH/USD): تارگت بزرگ بعدی کجاست؟
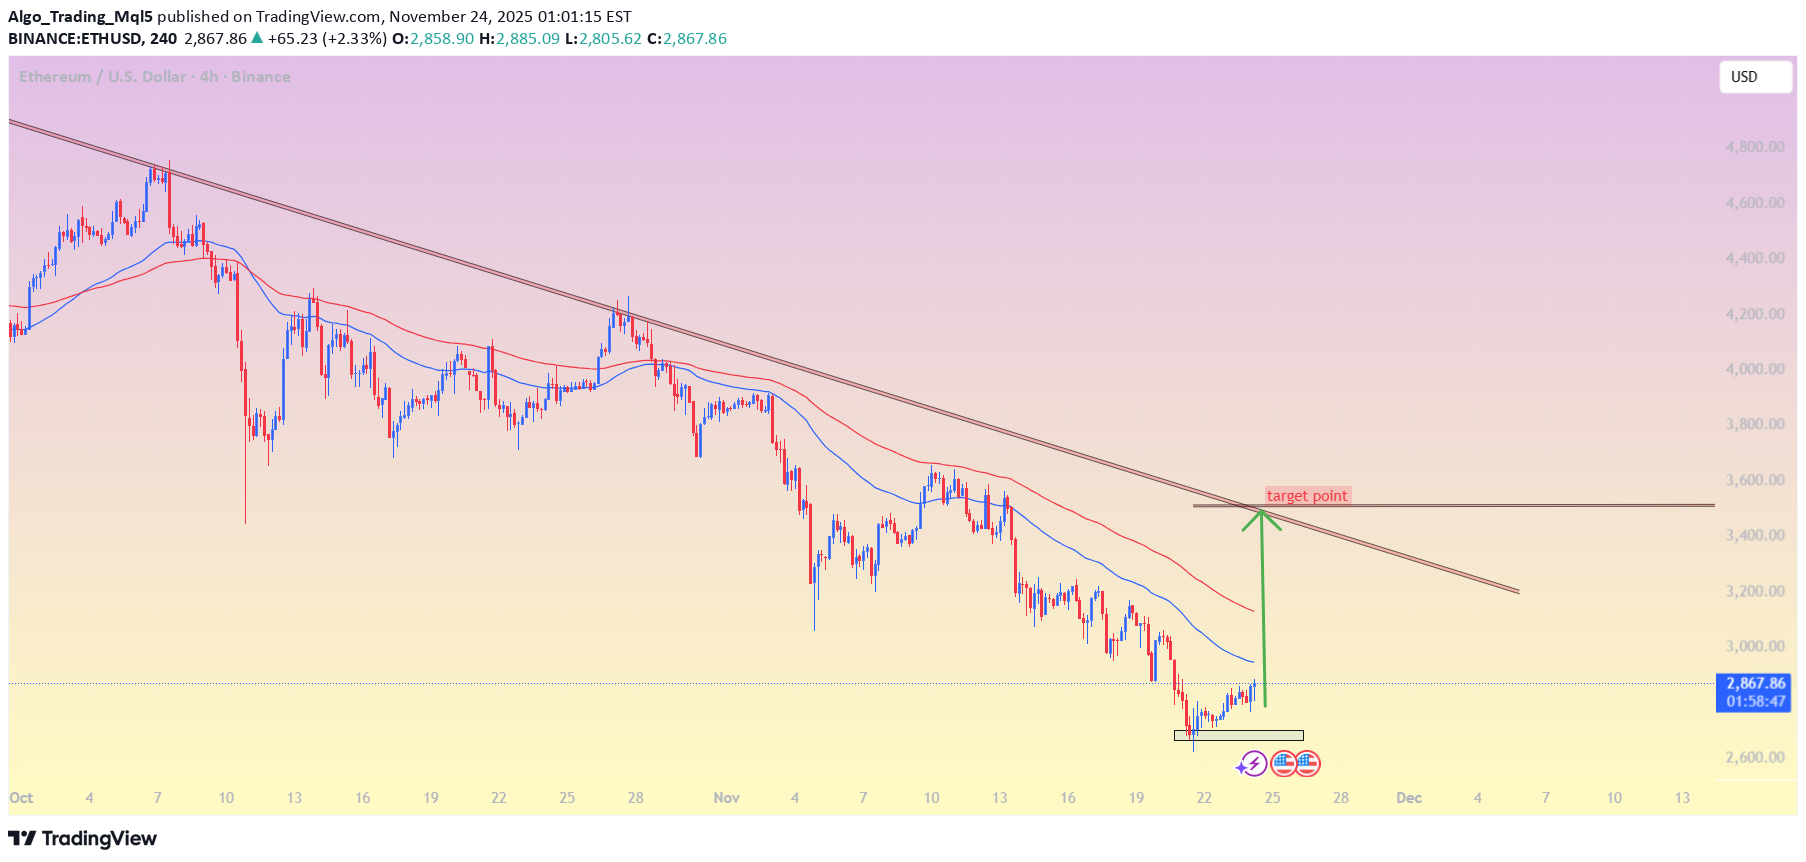
ETHUSD 4H Chart Pattern 📌 Target Zone My chart shows price around $2,860 and the trendline resistance sitting roughly around: ➡ Target: $3,450 – $3,550 This zone comes from: The descending trendline (major resistance) The level my marked with the green arrow Previous reaction zone where price last rejected 🔍 Why this target Price is forming a short-term bottom. A bounce toward the trendline resistance is reasonable if momentum continues. That trendline is the next major obstacle for bulls. ⚠ Important These are technical analysis levels, not financial advice. Always evaluate risk and market conditions. If my want, I can also give: ✔ Support levels ✔ Breakout target ✔ Stop-loss ideas (educational) ✔ Updated analysis with timeframe my preferactive active
Algo_Trading_Mql5
پیشبینی سقوط طلا (XAUUSD): هدف نهایی ۴۰۰۰ دلار کجاست؟
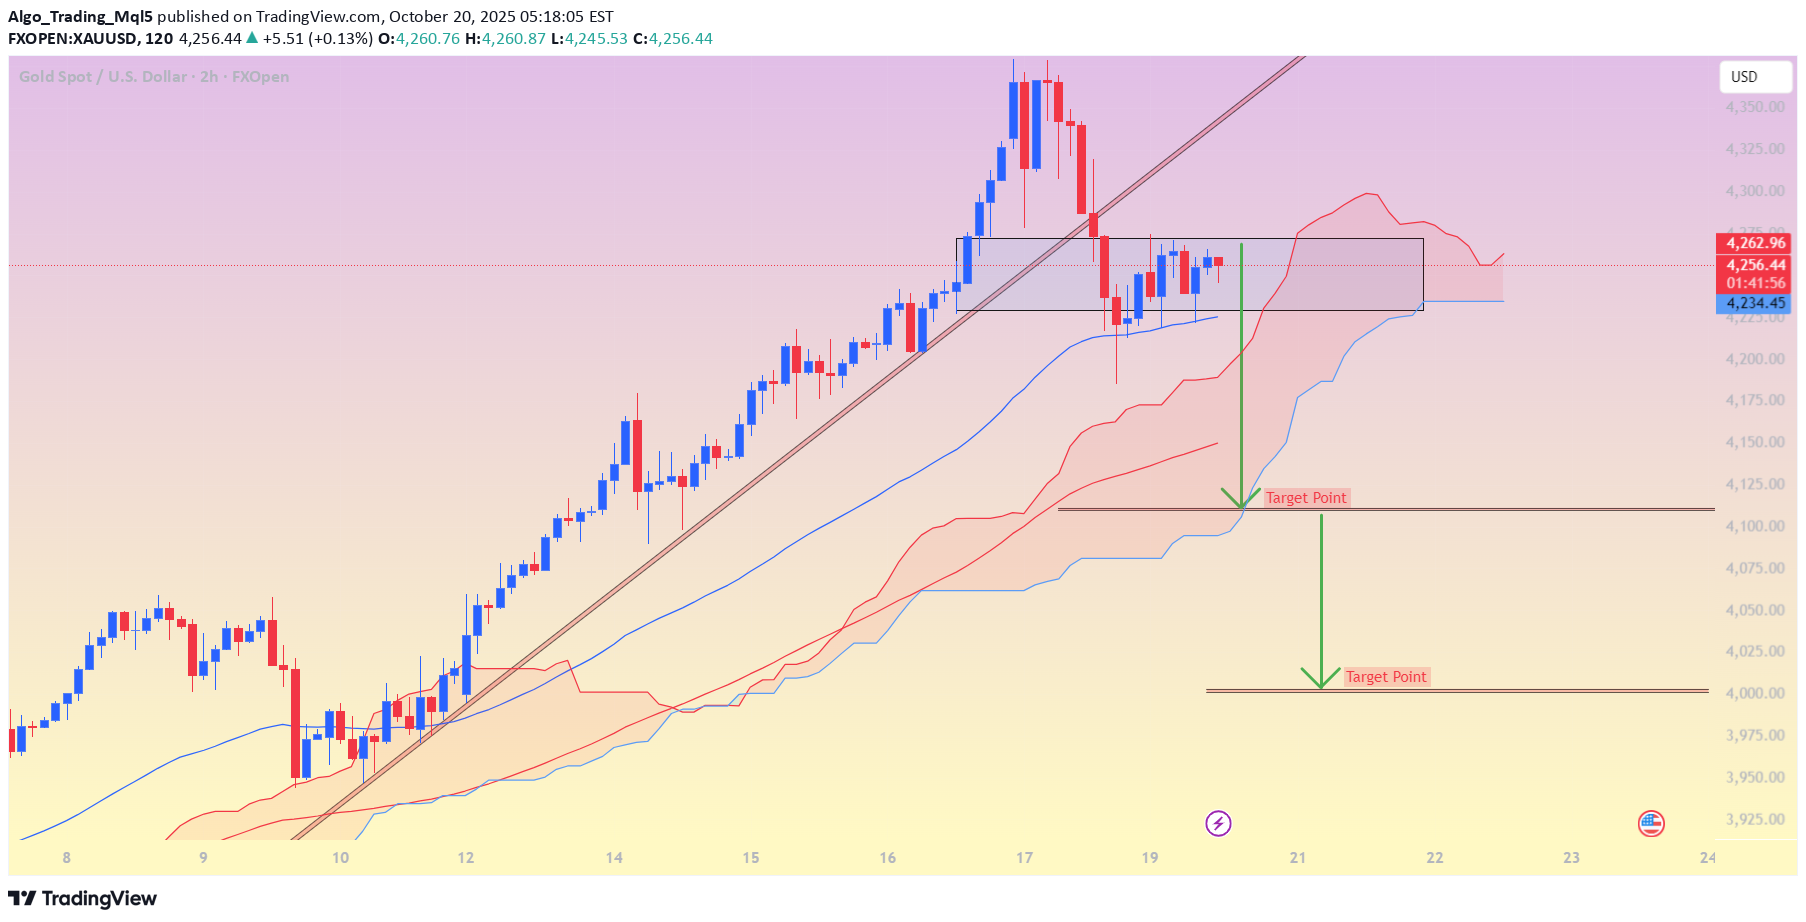
✅ The asset being analyzed is XAUUSD (Gold/USD). ✅ Timeframe: 2h (2-hour) ✅ Indicators: Ichimoku Cloud, trendlines, support/resistance box. ✅ Price at the moment of the screenshot: $4,246.33. ✅ A “Target Point” label is already plotted at approximately $4,000 on the chart. 📉 Analysis Based on My Chart The price broke below a steep ascending trendline. It is now consolidating in a range just above the Ichimoku cloud. A downward projection (green arrow) has been drawn to the next major support level. The “Target Point” label on your chart is positioned near $4,000, indicating a potential bearish move target. This aligns with the lower edge of the visible support zone on your Ichimoku cloud and horizontal level drawn. 👉 Estimated target range: Primary Target: ~$4,000 – $4,020 Intermediate support zone: ~$4,150 – $4,180 (watch for bounce or rejection) ⚠ Caution This is a technical target based on chart structure, not a guaranteed outcome. If price reclaims the top of the box (~$4,275), this bearish scenario may be invalidated. Always consider stop-loss placement and risk management.trade active
Algo_Trading_Mql5
پیشبینی سقوط طلا (XAU/USD): اهداف نزولی با تایید ابر ایچیموکو!
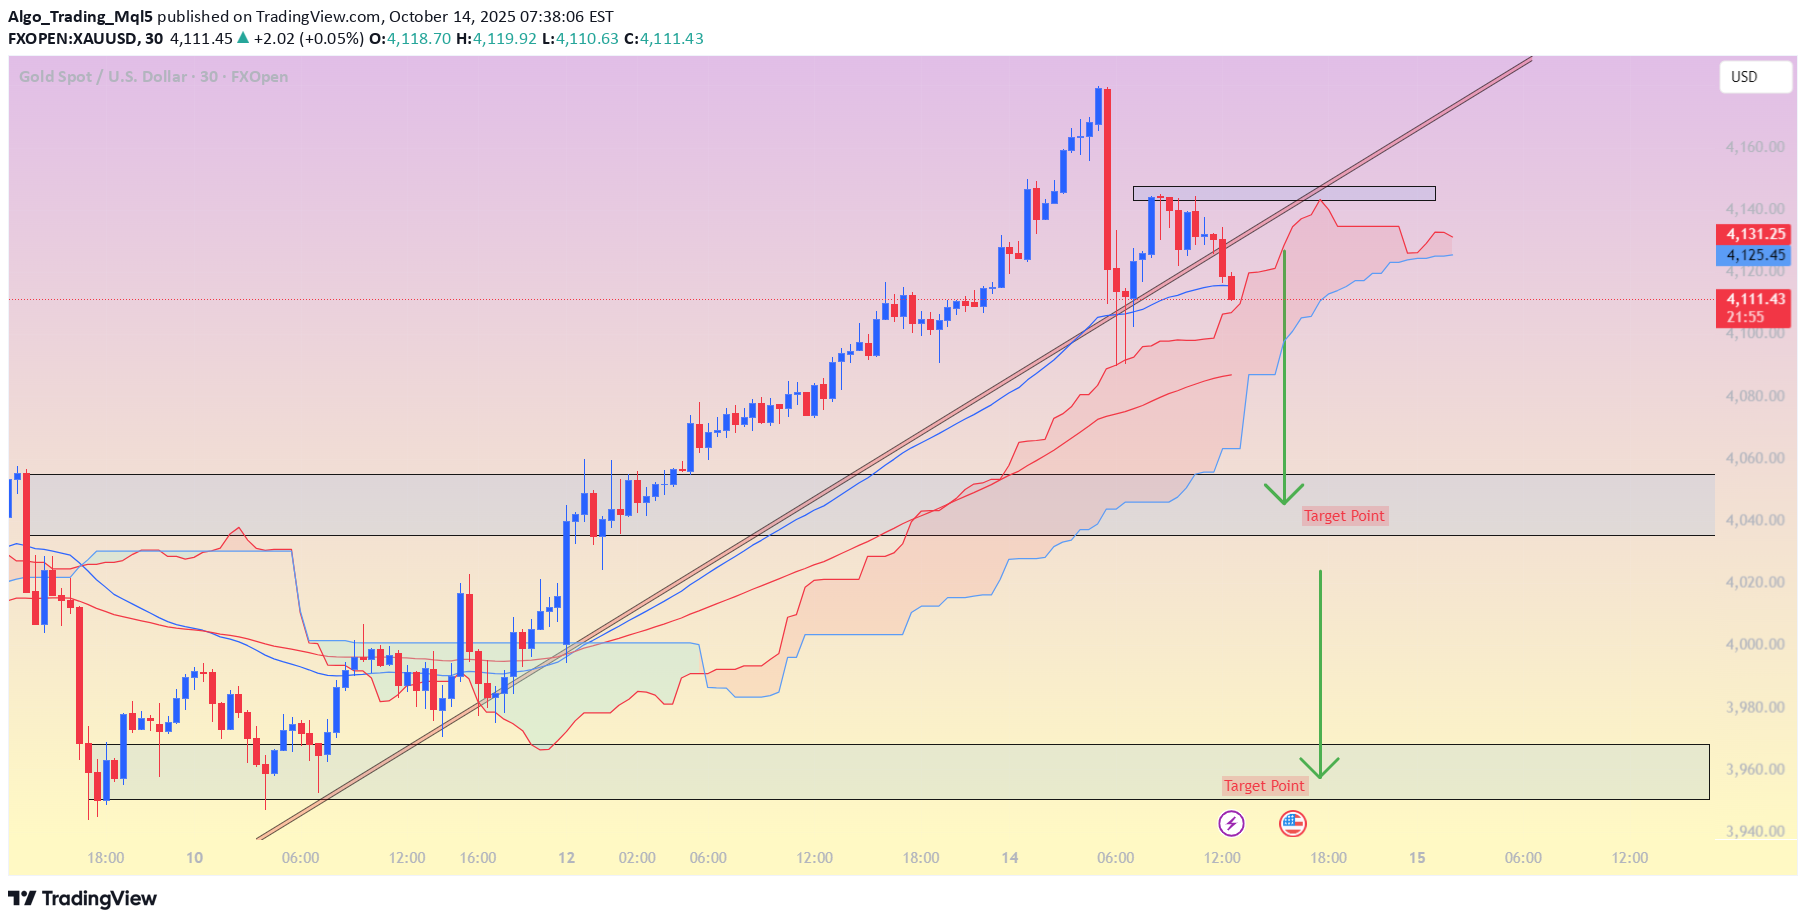
XAU/USD (Gold vs. USD) on the 30-minute timeframe, showing a bearish flag breakdown setup with Ichimoku Cloud confirmation. Here’s the detailed target breakdown 👇 --- 🔹 Current Price ≈ $4,112 --- 🔹 First Target Zone $4,040 – $4,060 This matches the first “Target Point” marked on my chart. It’s the measured move of the flag pattern — short-term bearish target once the current trendline breaks clearly below the cloud. Expect partial profit taking or a pullback here. --- 🔹 Second Target Zone $3,960 – $3,980 This is the final target area labeled on my chart. It corresponds to a major demand zone (previous consolidation + Ichimoku base support). If momentum continues bearish, price can extend to this zone. --- 📉 Summary TargetPrice RangeTypeNotes 🎯 Target 1$4,040 – $4,060Short-termFirst bearish objective 🎯 Target 2$3,960 – $3,980Mid-termFull flag breakout targettrade active
Algo_Trading_Mql5
تحلیل تکنیکال بیت کوین (BTC): هدفهای صعودی جدید تا سقف ۱۲۶,۰۰۰ دلار!
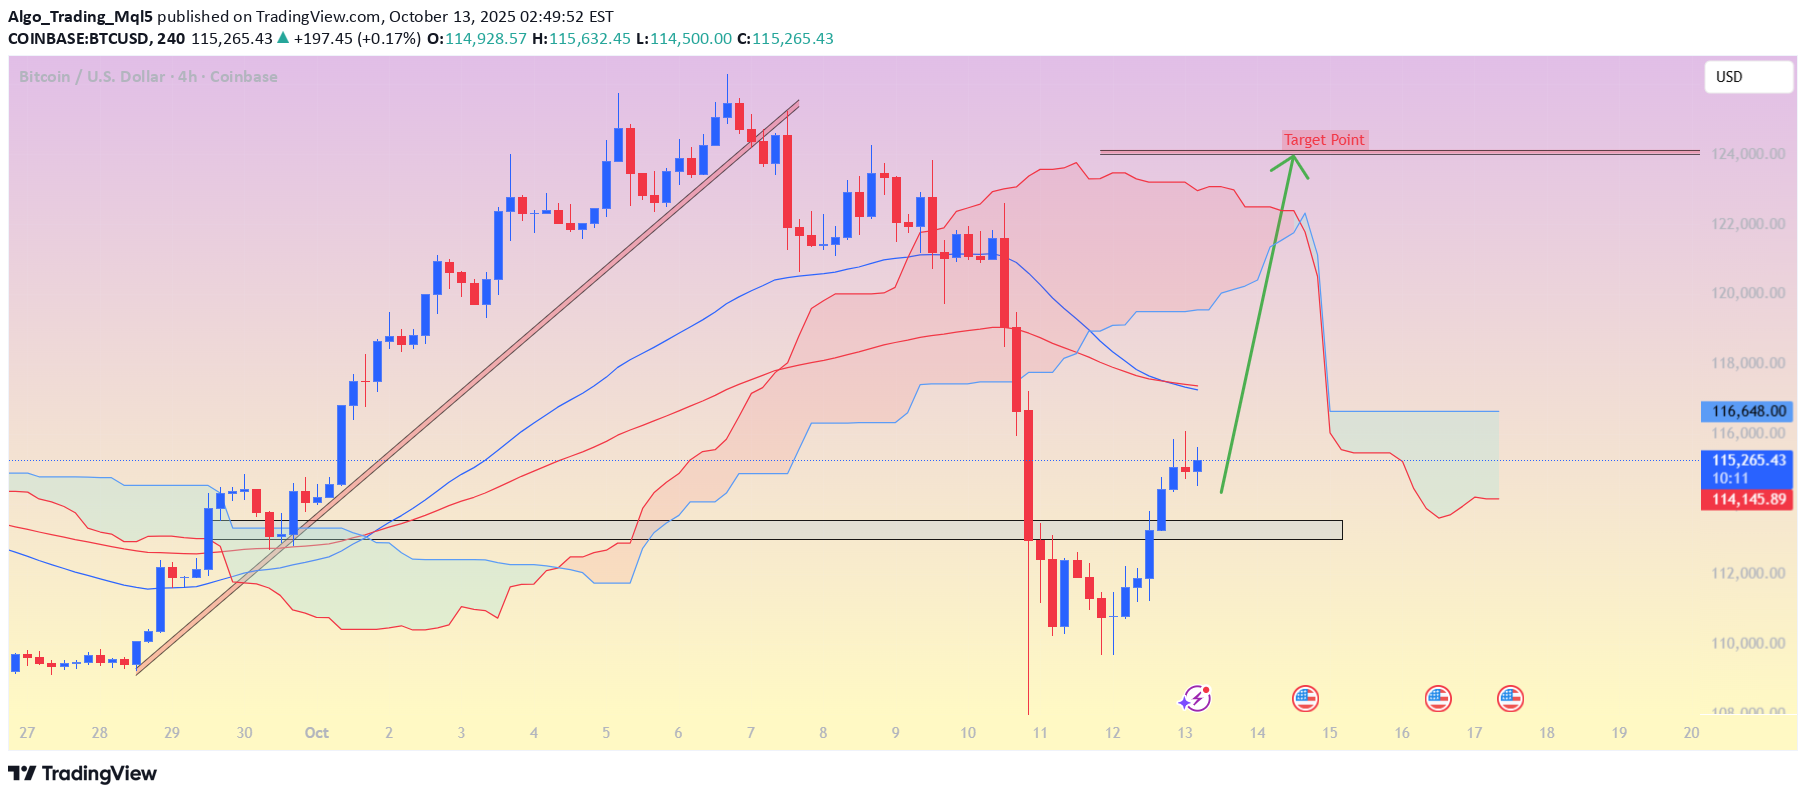
BTC/USD (Bitcoin) 4H chart 👇 ✅ Current Price: around $115,500 ✅ Trend: Recovery phase after a sharp drop — price bounced from support and now climbing inside Ichimoku cloud. ✅ Market Structure: Forming a bullish correction toward resistance / target zone. --- 🎯 Target Levels 1. Primary Target (My marked “Target Point”): $122,000 – $124,000 This matches the top of the Ichimoku cloud and previous resistance area. Likely hit if BTC sustains above $116,000 with strong candles. 2. Extended Target: $125,000 – $126,000 Possible if it breaks above $124,000 cleanly with momentum and volume support. --- 🛡 Support / Stop-Loss Immediate support: $114,000 – $114,500 (previous breakout zone). Major support: $112,000 – $112,500 (previous swing low). Stop-loss: below $113,800 to stay under the recent structure base. --- 🔍 Summary Trend bias: Bullish retracement Buy zone: $114,500 – $115,500 Target 1: $122,000 – $124,000 Target 2: $125,000 – $126,000 Stop-loss: below $113,800trade active
Algo_Trading_Mql5
تحلیل تکنیکال طلا (XAU/USD) در تایم فریم 1 ساعته: اهداف صعودی و نقاط کلیدی خرید و فروش
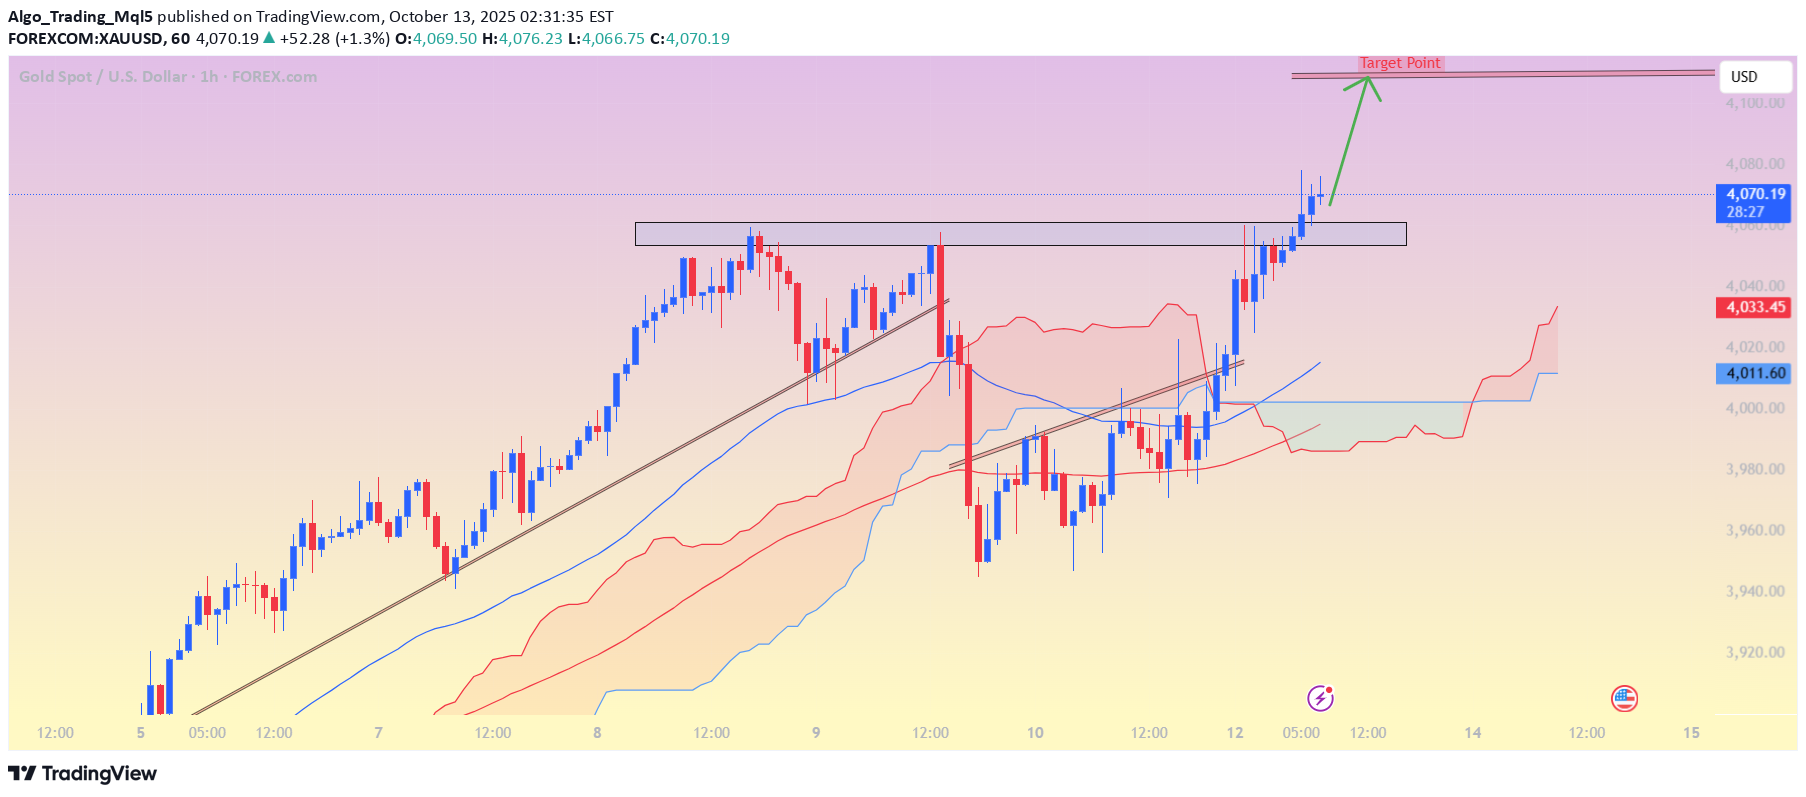
XAU/USD (Gold) chart on the 1H timeframe, here’s a clear breakdown 👇 ✅ Current Price: around $4,075 ✅ Trend: Strong bullish momentum — price above Ichimoku Cloud and previous resistance ✅ Structure: Clean breakout above the last horizontal zone (around $4,060), heading toward the next resistance area marked “Target Point.” --- 🎯 Target Levels 1. Primary Target (my marked zone): $4,110 – $4,125 This aligns perfectly with the upper resistance shown on My chart. It’s also near the previous high from 4H timeframe. 2. Extended Target (if momentum continues): $4,145 – $4,155 Potential extension if 1H candle closes strongly above $4,125. --- 🛡 Support / Stop-Loss Immediate support: $4,055 – $4,060 (previous breakout zone). Strong support: $4,030 – $4,035 (EMA + top of Ichimoku cloud). Stop-loss: below $4,030 (to stay safe under breakout structure). --- 🔍 Summary Trend bias: Bullish Buy zone: $4,060 – $4,070 (on retest) Target 1: $4,110 – $4,125 Target 2: $4,145 – $4,155 Stop-loss: below $4,030 ---trade activetarget done
Algo_Trading_Mql5
BTC/USD (1H chart) setup
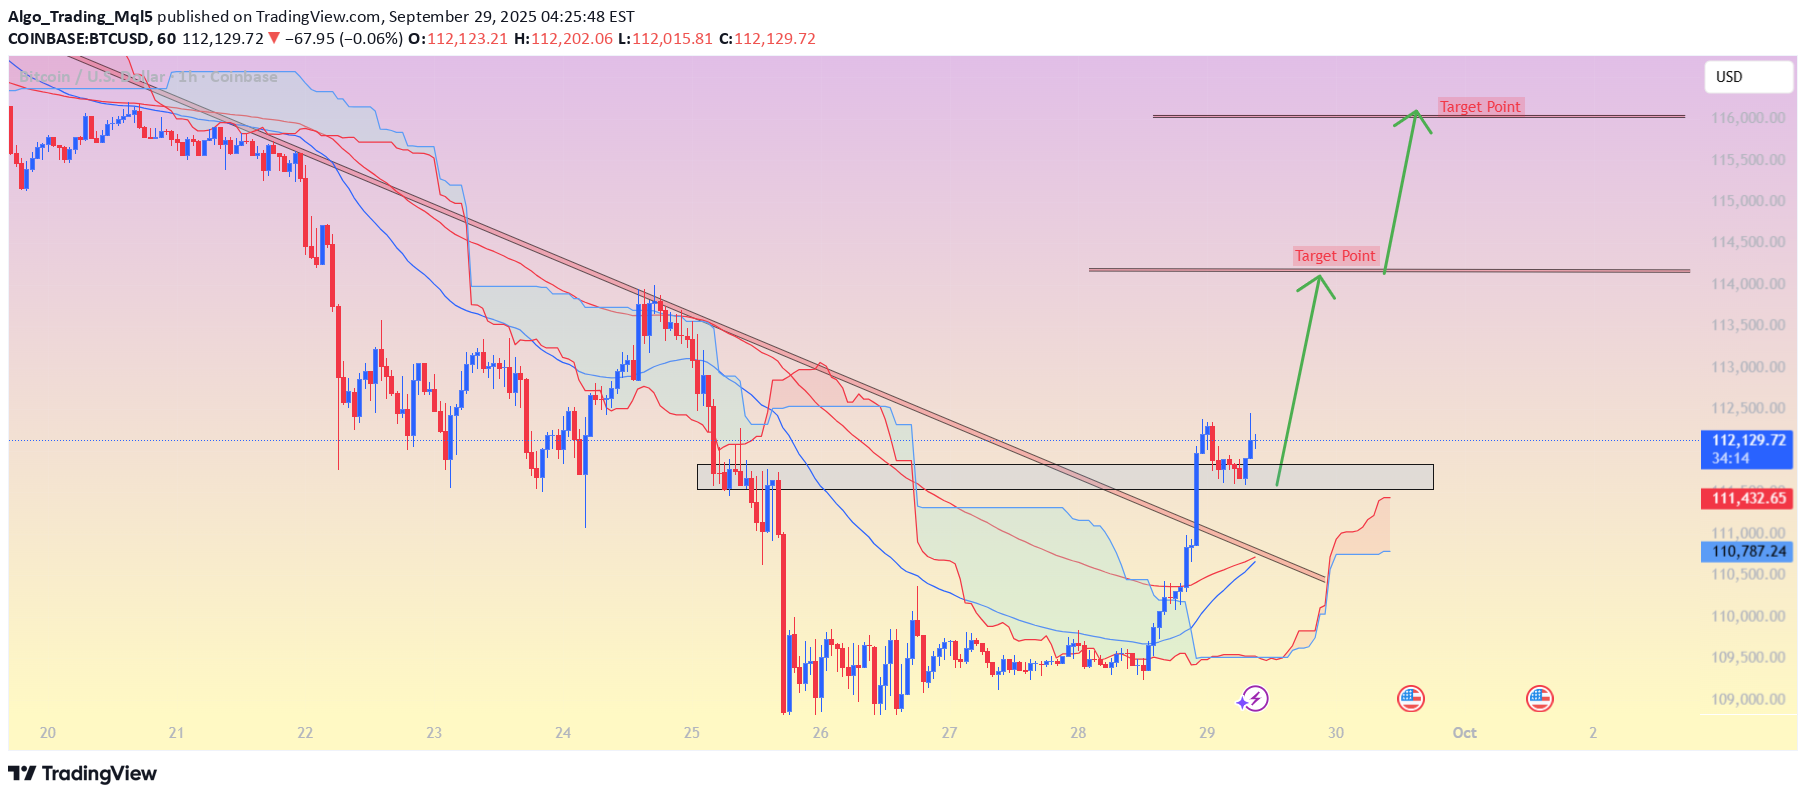
BTC/USD (1H chart) setup. Let’s break it down: Current price is around 112,100. Price has broken above the downtrend line and retested the breakout zone (grey box). Ichimoku cloud is showing bullish momentum. Chart has two target levels marked. 📌 Target Levels (based on my chart & structure): First Target (short-term): 114,500 – 114,800 Second Target (extended): 115,800 – 116,200 🔑 Support to watch: 111,400 (immediate support) 110,800 (cloud + key support zone) ⚠ If BTC closes below 111,400, upside momentum weakens.trade active
Algo_Trading_Mql5
XAUUSD (Gold Spot) on the 1H timeframe:
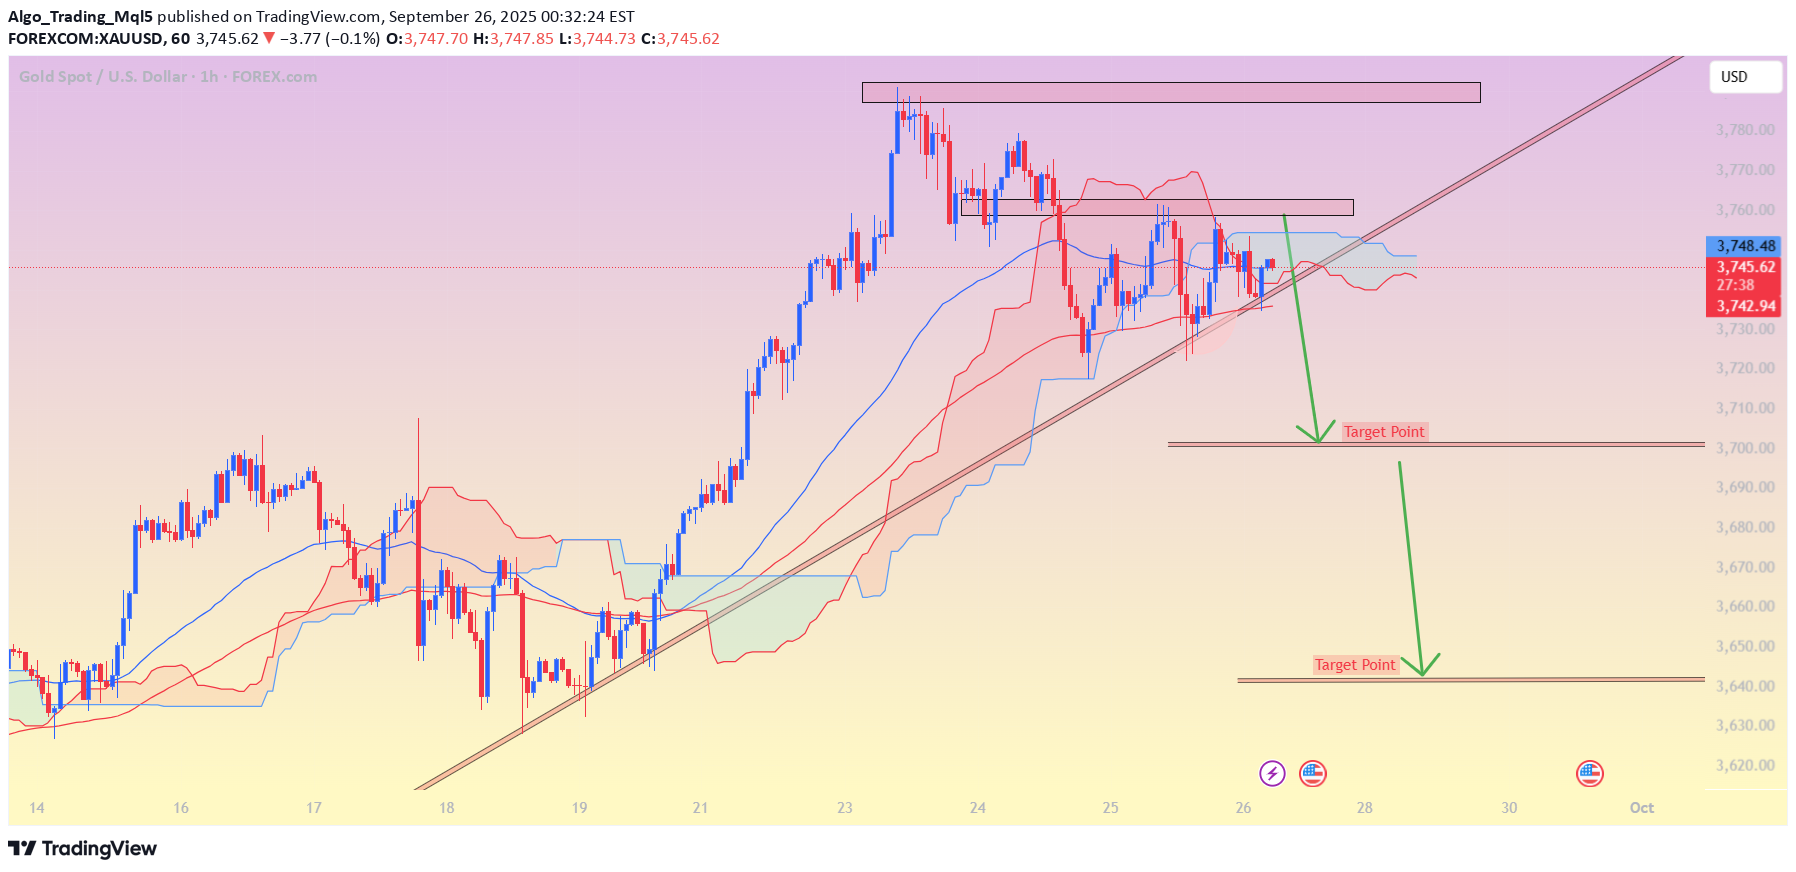
XAUUSD (Gold Spot) on the 1H timeframe: Price is currently at 3746.59. I have drawn an ascending trendline, but price is struggling near resistance (highlighted zone). The chart also shows two downside target points if the trendline breaks: Target Levels: 1. First Target Zone: Around 3700 (near-term support). 2. Second Target Zone: Around 3640–3650 (deeper support). So if the trendline breaks and bears take control, my downside targets would be: ✅ Target 1: 3700 ✅ Target 2: 3640–3650trade active
Algo_Trading_Mql5
XAU/USD (Gold vs USD) Chart Pattern..
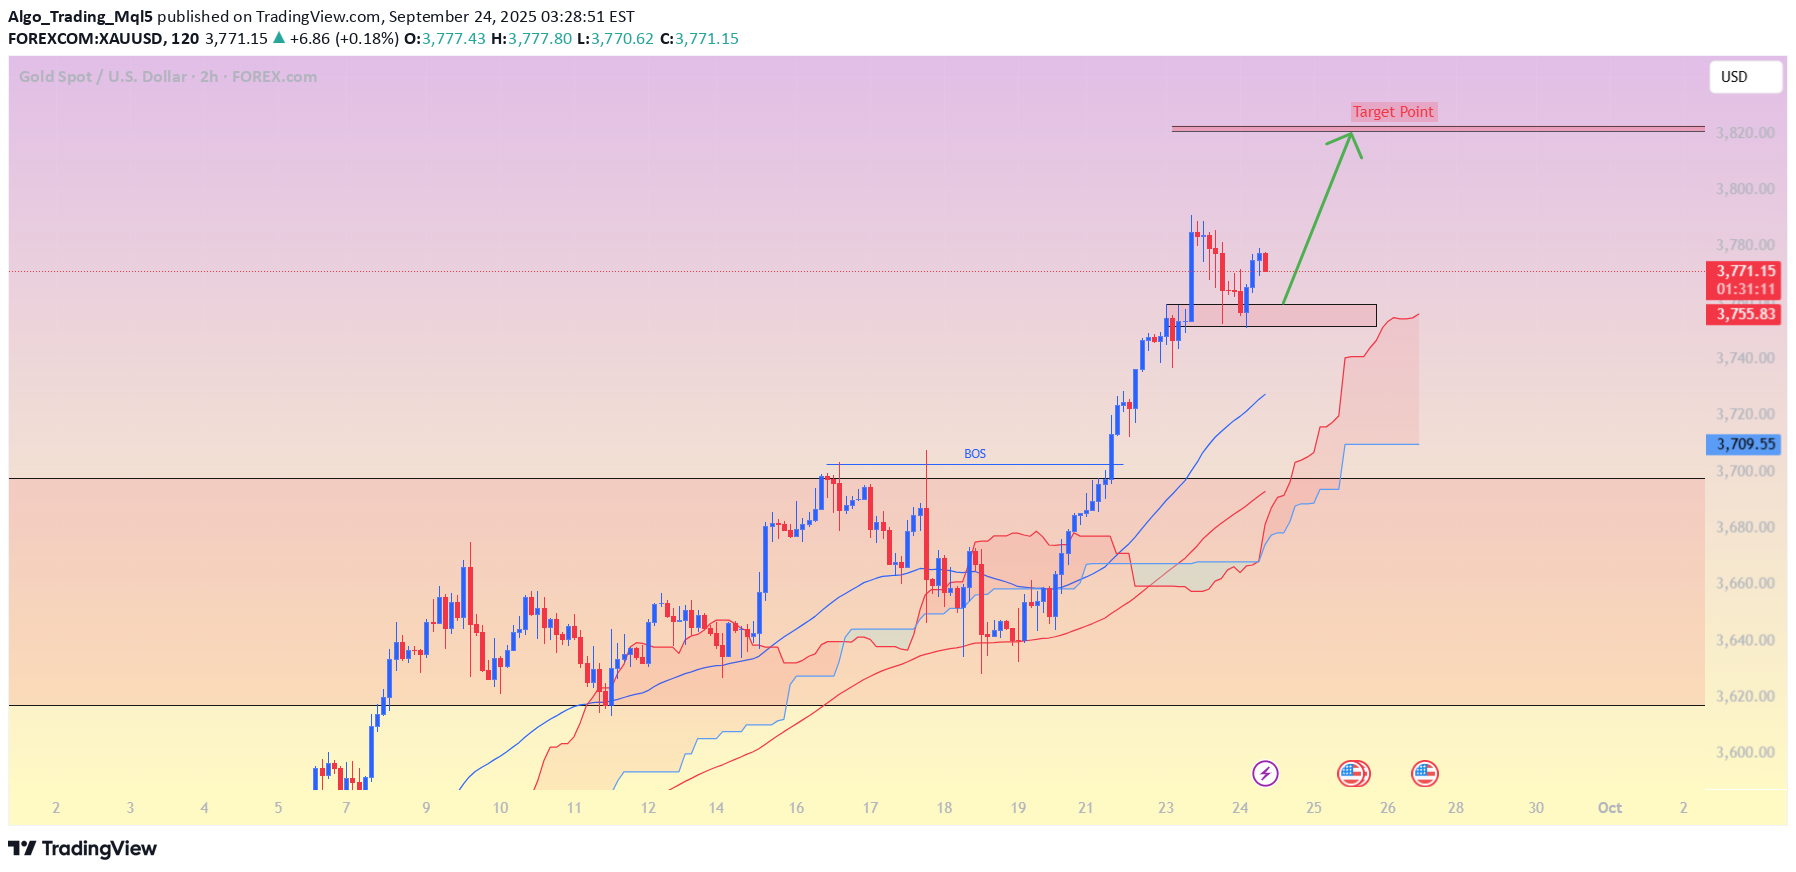
XAU/USD (Gold vs USD): Current price: $3,770 My chart shows an uptrend with bullish structure after a Break of Structure (BOS). There is a target point marked around $3,820. The chart suggests continuation upward, with support around $3,755–$3,760. 📌 Target: Based on My setup, the next resistance/target level is $3,820 – $3,821.trade activetarget done
Algo_Trading_Mql5
BTCUSD (Bitcoin / USD) on the 2H timeframe.
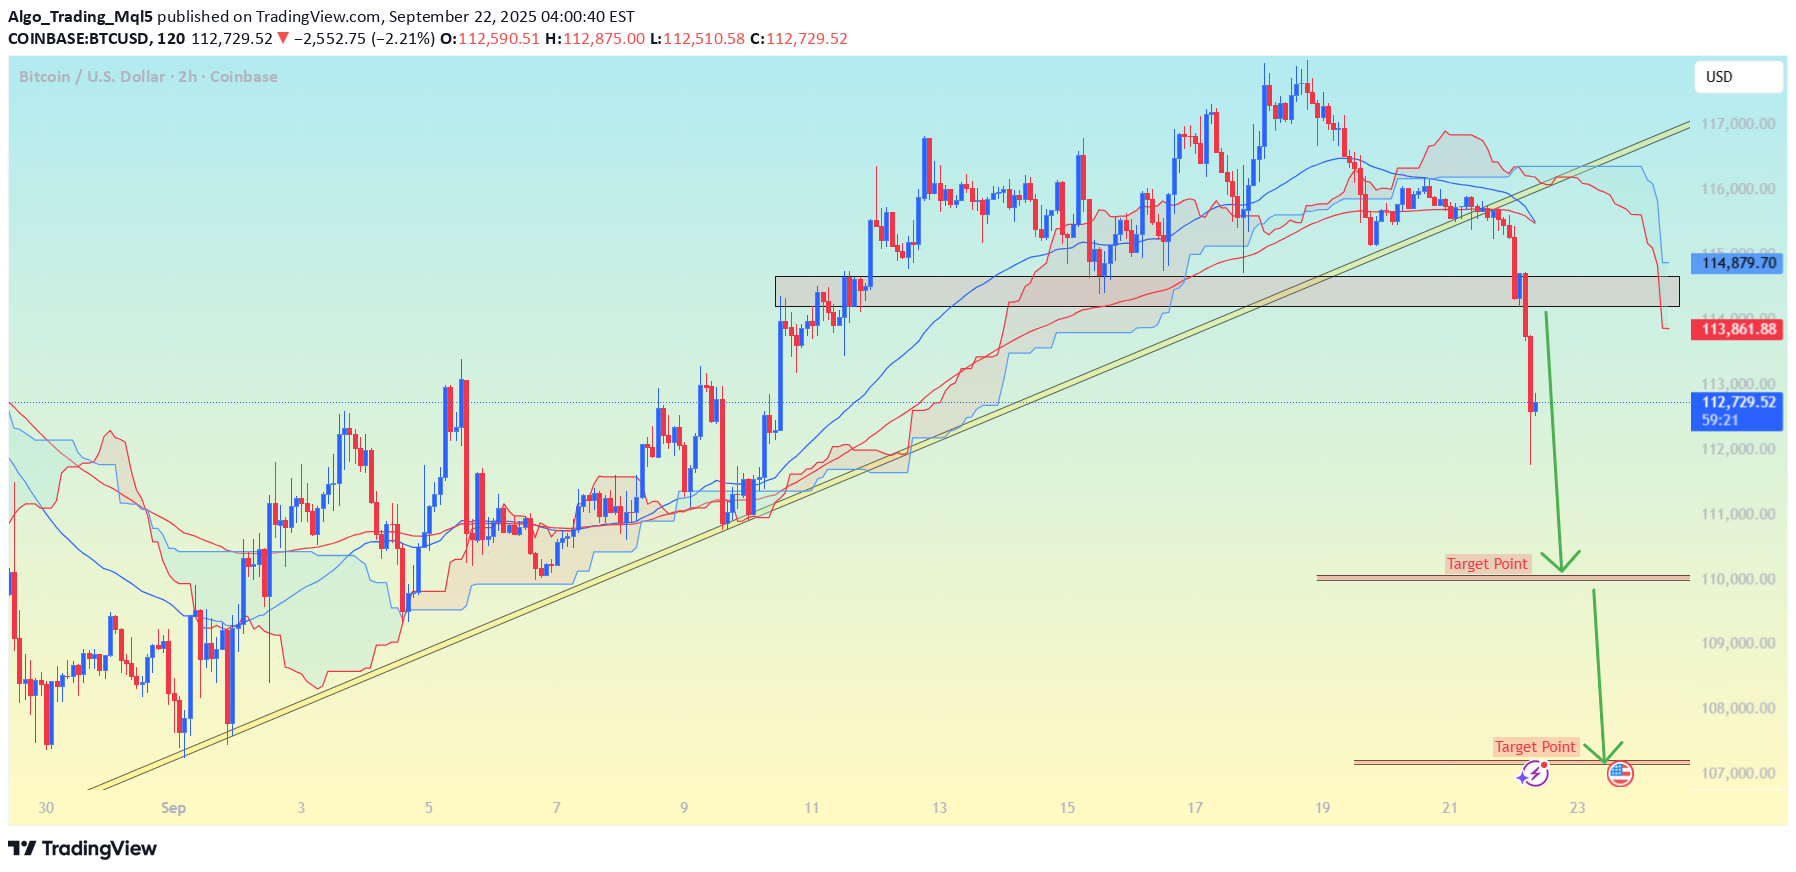
BTCUSD (Bitcoin / USD) on the 2H timeframe. Current price is around 112,721. Price has broken below the rising trendline and the Ichimoku cloud, confirming bearish momentum. Strong sell-off candles indicate continuation to the downside. I have marked two target levels on the chart. 📉 Downside targets visible on my chart: First Target Point: Around 110,000 Second Target Point: Around 107,000 – 108,000 ⚠ Key notes: Resistance now lies at 114,000 – 115,000 zone (previous support). If BTC retests this zone and fails, downside continuation is likely. If price closes back above 115,000, bearish setup weakens.trade active
Algo_Trading_Mql5
XAUUSD (Gold vs USD).
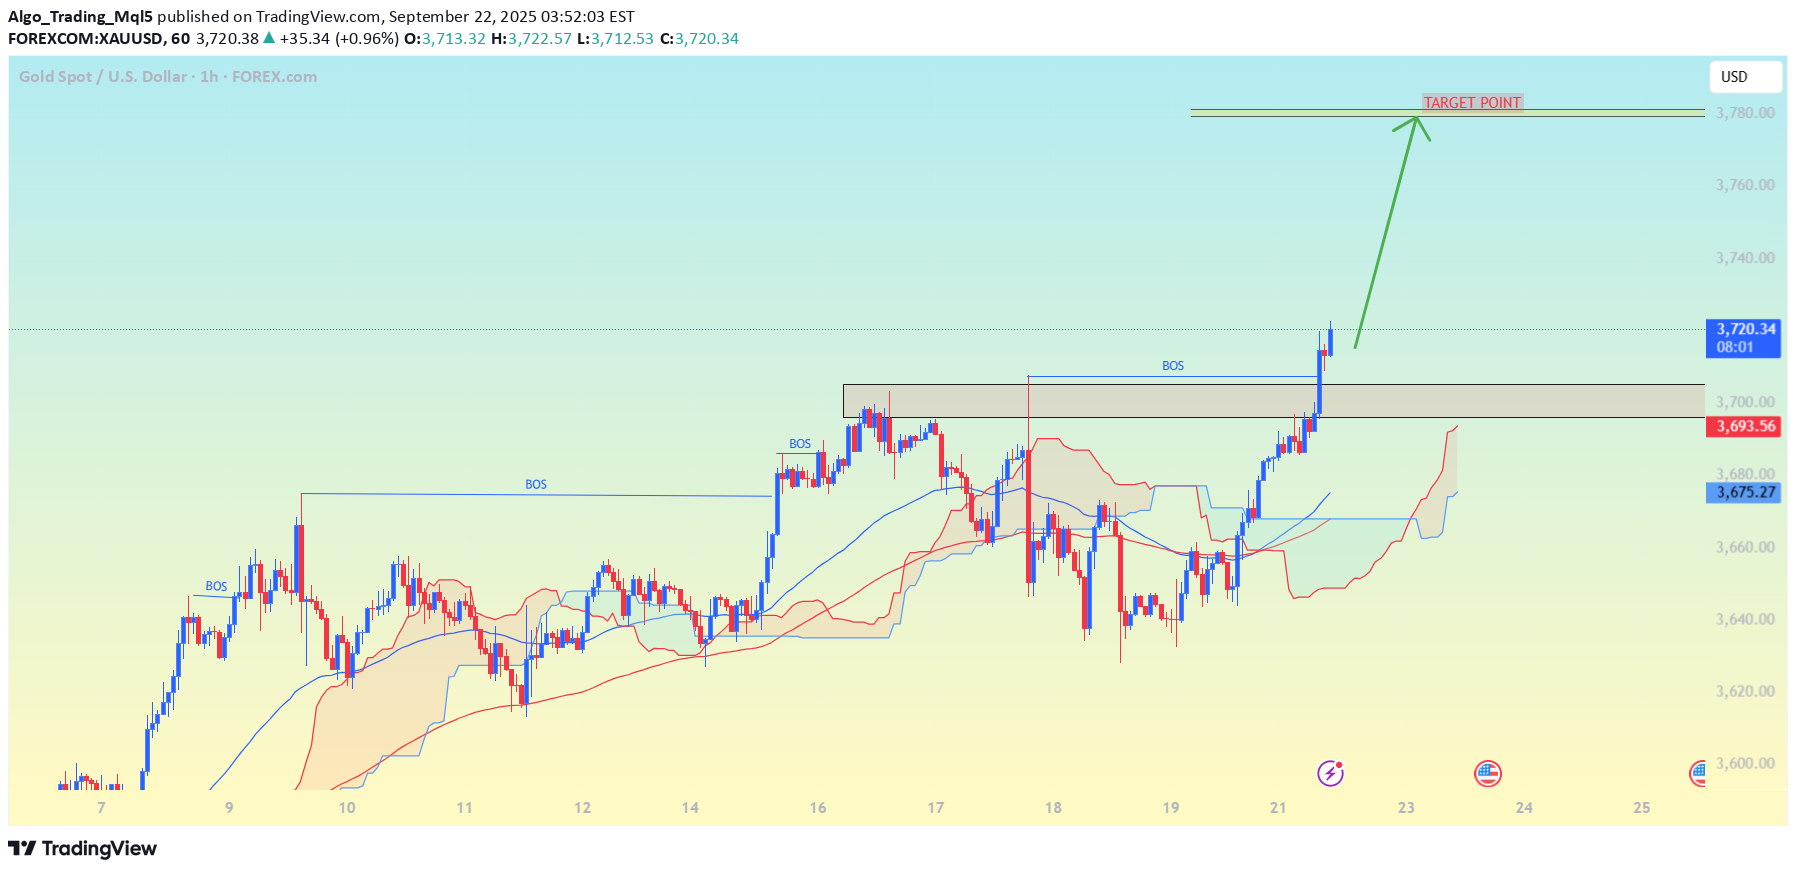
The pair is XAUUSD (Gold vs USD). Current price is around 3,721.15. The chart timeframe is 1H (hourly). I have marked a "TARGET POINT" at 3,780.79. The chart shows a bullish breakout above 3,700 resistance, confirmed by BOS (Break of Structure). Ichimoku cloud and trend lines are showing bullish bias. 👉 Based on the chart, my immediate target is 3,780.79. If momentum continues strongly, the next psychological resistance would be around 3,800 – 3,820. ⚠ However, keep in mind: Support is now at 3,700 (breakout level). If price falls back below this, the bullish setup weakens.trade activetarget done
Disclaimer
Any content and materials included in Sahmeto's website and official communication channels are a compilation of personal opinions and analyses and are not binding. They do not constitute any recommendation for buying, selling, entering or exiting the stock market and cryptocurrency market. Also, all news and analyses included in the website and channels are merely republished information from official and unofficial domestic and foreign sources, and it is obvious that users of the said content are responsible for following up and ensuring the authenticity and accuracy of the materials. Therefore, while disclaiming responsibility, it is declared that the responsibility for any decision-making, action, and potential profit and loss in the capital market and cryptocurrency market lies with the trader.