
Alexgoldhunter
@t_Alexgoldhunter

What symbols does the trader recommend buying?
Purchase History
پیام های تریدر
Filter
Alexgoldhunter
Liquidity Engineered | Wave 5 Ignition Zone
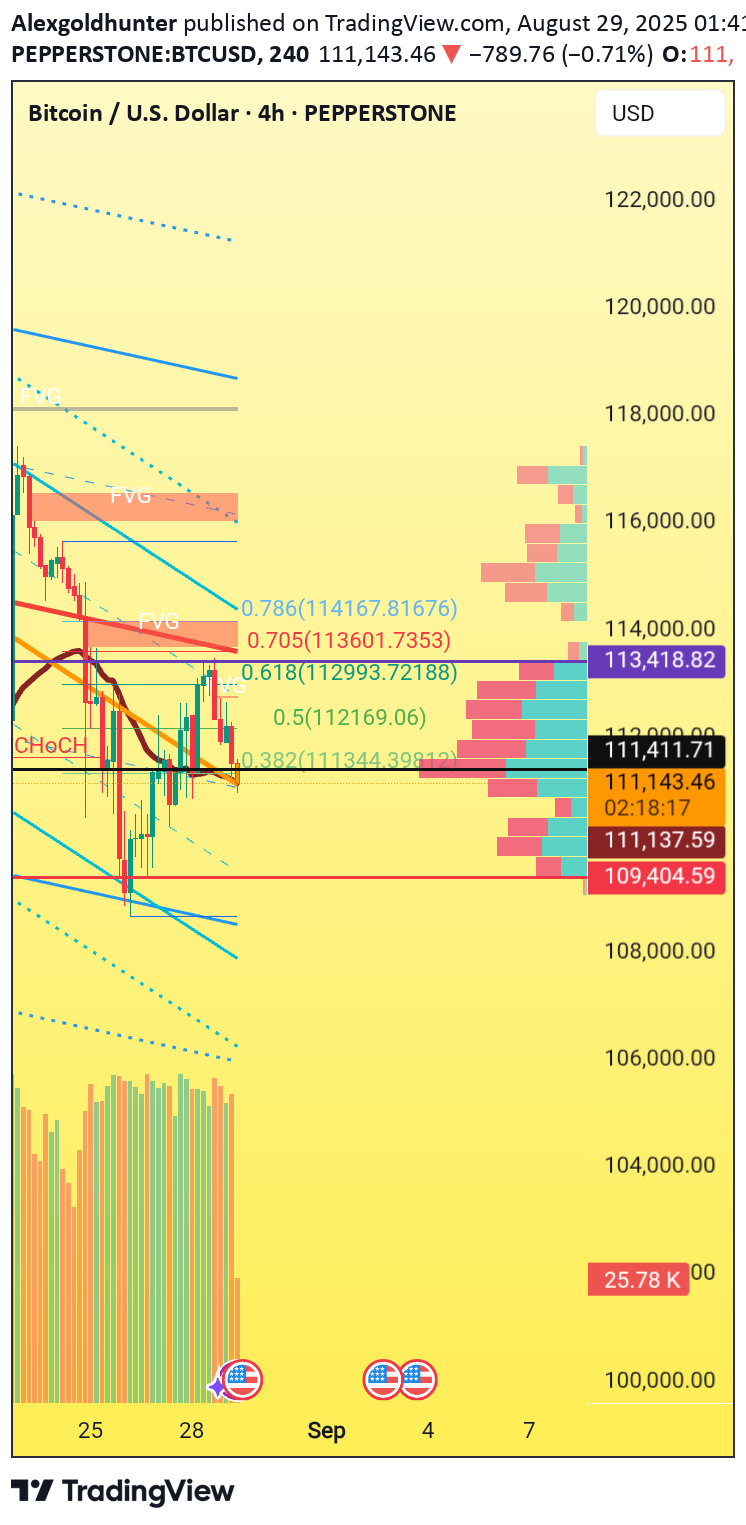
XAUUSD Liquidity Engineered | Wave 5 Ignition Zone 🧠 Smart Money Concepts (SMC) ChoCH (Change of Character) is clearly marked, signaling a shift from bullish to bearish structure. Fair Value Gap (FVG) near 116k suggests unmitigated institutional imbalance—likely a magnet for price. Liquidity Zones: Price recently swept below a prior low near 111k, hinting at engineered liquidity grab before reversal. Order Block: Bullish OB sits just below 111k, aligning with the 0.5 Fibonacci level—potential mitigation zone. Trap Setup: The sweep below 111k followed by a sharp recovery could be a classic “stop hunt” before rallying into premium. 🌊 Elliott Wave Theory Wave Count: Appears to be in Wave 4 corrective phase after a strong impulsive Wave 3. Corrective Structure: Likely forming a flat or expanded flat, with Wave C targeting the 0.786 retracement (~116.1k). Forecast: If Wave 5 initiates, expect a push toward 118k–120k zone, aligning with volume profile resistance. 📈 Dow Theory Primary Trend: Higher highs and higher lows confirm an uptrend. Volume Confirmation: Volume spikes align with bullish moves, supporting accumulation phase. Divergence: Dow’s bullish structure slightly contradicts SMC’s ChoCH—suggesting short-term bearish trap within a larger bullish context. 🕯️ Candlestick Patterns Engulfing Candle near 111k zone supports bullish reversal. Pin Bar rejection at 0.618 level (~113k) adds confluence for upward momentum. Inside Bar formation near 112k signals consolidation before breakout. 📊 RSI Analysis Current RSI: Hovering near 40–45, approaching oversold territory. Bullish Divergence: RSI forming higher lows while price made lower lows—classic reversal signal. Multi-Timeframe Confluence: 4H and 1D RSI both show bullish divergence—strengthens reversal thesis. 📉 MACD Analysis MACD Crossover: Bullish crossover forming, histogram shifting from red to green. Momentum Shift: Histogram shows decreasing bearish momentum—potential start of Wave 5. MACD Divergence: Price made lower lows while MACD made higher lows—supports bullish bias. 🚀 BTC/USD Long Setup Buy Entry: 111,400 TP1: 113,800 TP2: 116,000 SL: 110,200 🧭 Actionable Insights & Psychological Checkpoints Confluence Zone: 111k–113k is a high-probability reversal pocket supported by SMC, Elliott Wave, RSI, and MACD. Risk Management: SL below OB and liquidity sweep ensures protection against deeper manipulation. Mindset Tip: Stay disciplined—don’t chase candles. Let price confirm with volume and structure before entry. Watch for: Break above 113k with volume = confirmation of Wave 5. Failure = possible deeper retracement. ⚠️ Disclaimer:This analysis is for educational and informational purposes only. It does not constitute financial advice or a recommendation to buy or sell any asset. Trading involves risk, and past performance is not indicative of future results. Always conduct your own research and consult with a licensed financial advisor before making investment decisions. The author is not responsible for any financial losses incurred from trading decisions based on this content.
Alexgoldhunter
Gold Spot: Fibonacci & Smart Money Trade Strategy

XAUUSD Gold Spot Fibonacci Liquidity Zones & Smart Money Trading StrategyComprehensive AnalysisChart Observations:Your Gold Spot (XAU/USD) 4-hour TradingView chart, published on April 20, 2025, integrates key elements such as Fibonacci retracement levels, trend lines, Fair Value Gaps (FVG), and support/resistance zones.Current Price: 3,327.12 USDMajor Resistance Levels: 3,342.50 USD3,328.70 USDImmediate Support Levels: 3,311.60 USD3,310.84 USD________________________________________Fibonacci Retracement Levels:These levels highlight potential reversal zones:0.382 Level: 3,295.08 USD0.5 Level: 3,275.71 USD0.618 Level: 3,256.34 USD0.705 Level: 3,242.06 USD0.786 Level: 3,228.77 USDFair Value Gaps (FVGs):Two marked zones indicate possible liquidity grabs where price may fill gaps.Trend Lines & Channels:Ascending and descending formations suggest continuation or reversal patterns.________________________________________Trading Strategy:Buy Setup:Entry: 3,275.71 USD (Support Zone)Take Profit 1 (TP1): 3,311.60 USD (+359 pips).Take Profit 2 (TP2): 3,342.50 USD (+668 pips).Stop Loss (SL): 3,242.06 USD (-336 pips).Sell Setup:Entry: 3,342.50 USD (Resistance Level)Take Profit 1 (TP1): 3,311.60 USD (-309 pips).Take Profit 2 (TP2): 3,275.71 USD (-668 pips).Stop Loss (SL): 3,360.00 USD (+175 pips).________________________________________Final Thoughts:This Gold Spot (XAU/USD) analysis integrates Fibonacci retracement levels, Smart Money Concepts (SMC), Fair Value Gaps (FVGs), volume profile, and trend patterns, providing high-probability trade setups. Let me know if you need refinements or another asset breakdown! 🚀
Alexgoldhunter

XAUUSD Gold CFDs Uptrend with Elliott Waves, SMC, and Volume Profile1. Identifying Trends using Dow TheoryPrimary Trend: Uptrend Characteristics:Higher Highs (HH) and Higher Lows (HL): The chart shows a series of HH and HL, confirming the uptrend.Volume Confirmation: Volume Profile indicates significant volume concentrations at certain price levels, supporting the upward trend.High-Volume Nodes (HVNs) & Low-Volume Nodes (LVNs): High-volume nodes around the price levels of 2,748.900, 2,758.640, and 2,757.230 act as support/resistance levels. Low-volume nodes suggest price acceptance and potential areas of rapid movement.2. Labeling Elliott Wave StructuresImpulse Waves (1-5):Wave 1: Begins at the bottom left and ends at the first peak.Wave 2: Corrective wave retracing part of Wave 1.Wave 3: Major upward impulse following Wave 2.Wave 4: Another correction after Wave 3.Wave 5: Final upward impulse completing the structure.Corrective Waves (A-B-C):Wave A: Following Wave 5, indicating a decline.Wave B: Minor retracement upwards.Wave C: Continuation of the decline, completing the correction.Validation Using Fibonacci:Key Fibonacci levels such as 0.786, 0.618, and 0.382 provide confirmation and possible retracement targets.Volume Profile Integration:Assessing volume concentration during each wave to understand the strength and potential exhaustion points.3. Applying Smart Money Concepts (SMC)Liquidity Zones:Identified around key levels using Volume Profile's Point of Control (POC) and value areas.POC: Approx. at 2,758.640, indicating a significant price acceptance level.Break of Structure (BOS):BOS identified at key levels where the price breaks previous highs/lows, indicating potential shifts.Stop Hunts:Potential stop hunts near levels with accumulated stop orders, such as 2,748.900 and 2,758.640.Accumulation and Distribution:Using Volume Profile to pinpoint areas where big players are accumulating or distributing.4. Formulating Buy/Sell StrategiesBuy Strategy:Entry: Around 2,745.573 where there's high volume and support.TP1: 2,758.640 (approx. 130 pips).TP2: 2,768.720 (approx. 230 pips).SL: Below recent low at 2,733.916 (approx. 116 pips).Sell Strategy:Entry: Near resistance at 2,768.720.TP1: 2,755.000 (approx. 137 pips).TP2: 2,740.000 (approx. 287 pips).SL: Above recent high at 2,780.000 (approx. 112 pips).Volume Profile Leverage:Entries and exits based on HVNs and LVNs for better accuracy.By integrating Volume Profile into the analysis, we gain a deeper understanding of price levels where significant trading activity occurs, helping to refine our strategies for more precise entries and exits. This comprehensive approach ensures clarity and actionable insights for traders.
Alexgoldhunter
Gold Spot: SMC & Elliott Wave Entry/Exit Strategies

XAUUSD Gold Spot: SMC & Elliott Wave Entry/Exit StrategiesComprehensive Analysis:Elliott Wave Analysis:The chart identifies a clear Elliott Wave pattern with labels 0, 1, 2, 3, 4, and 5.Wave 1 starts from the low at point 0 and peaks at point 1.Wave 2 retraces to point 2, followed by Wave 3 reaching a new high.Wave 4 retraces again, and Wave 5 completes the pattern.Smart Money Concepts (SMC):Break of Structure (BOS) is marked at several points indicating significant price movements.Fair Value Gaps (FVG) are highlighted, showing areas where price is likely to return to fill the gaps.Points of interest (POI) are marked with green triangles, indicating potential reversal zones.Fibonacci Retracement:Fibonacci levels are drawn from the low at point 0 to the high at point 1.Key levels include 0.382, 0.618, 0.705, and 0.786, which are potential support and resistance zones.Volume Profile:The volume profile on the right side of the chart shows the distribution of trading volume at different price levels.High volume nodes indicate strong support/resistance areas.Buy Strategy:Entry: Around 2,886.280 (Fibonacci 0.382 level and FVG zone)Take Profit 1 (TP1): 2,909.550 (Fibonacci 0.618 level)Take Profit 2 (TP2): 2,917.180 (Fibonacci 0.786 level)Stop Loss (SL): 2,860.000 (below the recent low and FVG zone)Sell Strategy:Entry: Around 2,939.840 (resistance level and high volume node)Take Profit 1 (TP1): 2,917.180 (Fibonacci 0.786 level)Take Profit 2 (TP2): 2,909.550 (Fibonacci 0.618 level)Stop Loss (SL): 2,950.000 (above the recent high)The image is a detailed technical analysis chart of Gold Spot (XAU/USD) using TradingView. It incorporates Smart Money Concepts (SMC) and Elliott Wave strategies, highlighting key levels such as Break of Structure (BOS), Fair Value Gaps (FVG), and Fibonacci retracement levels. The chart also includes a volume profile to show trading volume distribution, making it relevant for traders looking to identify potential buy and sell zones.Buy Strategy: Entry: Around 2,886.280 (Fibonacci 0.382 level and FVG zone)
Alexgoldhunter
XAU/USD Elliott Wave Analysis: Eye on the Powerful Wave 3

XAUUSD XAU/USD: Elliott Wave Analysis: Eye on the Powerful Wave 3Capitalizing on Wave 3Elliott Wave AnalysisUpon inspecting the Gold Spot (XAU/USD) chart:Wave Count: It appears that the market is currently in the middle of an impulse wave. We are likely in wave three (the most powerful and extended wave), which is typically the most lucrative wave for trading.Current Structure: The market previously completed waves 1 and 2. Wave 3 is in progress, potentially subdividing into smaller impulsive waves.Fibonacci Levels:For wave 3, the Fibonacci extension levels 1.618 and 2.618 are critical for take-profit targets.For wave 4, a retracement back to Fibonacci levels 0.382 or 0.5 is probable.Wave 5 should also consider the 0.618 extension for future movement.Buy StrategyEntry: After the completion of wave 4 retracement (around Fibonacci levels 0.382 or 0.5).Take Profit 1 (TP1): Fibonacci extension level 1.618.Take Profit 2 (TP2): Fibonacci extension level 2.618.Stop Loss (SL): Below the start of the current impulse wave (wave 4).Sell StrategyEntry: After the completion of wave 5, when a new corrective wave is expected to start.Take Profit 1 (TP1): Fibonacci retracement level 0.382.Take Profit 2 (TP2): Fibonacci retracement level 0.5.Stop Loss (SL): Above the recent high.VIP SignalBuy Signal:Entry: 2740TP1: 2784 (440 pips)TP2: 2835 (950 pips)SL: 2720 (200 pips)Sell Signal:Entry: 2840TP1: 2800 (400 pips)TP2: 2750 (900 pips)SL: 2860 (200 pips)This analysis incorporates Elliott Wave principles, Fibonacci levels, and key indicators displayed on the chart to provide a comprehensive trading strategy. Happy trading!Follow Alexgoldhunter for Latest Ideas and MindsEntry: 2740 Activated TP1: 2784 (440 pips)TP2: 2835 (950 pips)SL: 2720 (200 pips)almost 250 pips Done Great
Alexgoldhunter
BNB/USDT: Key Fibonacci and Volume Profile Reversal Zones
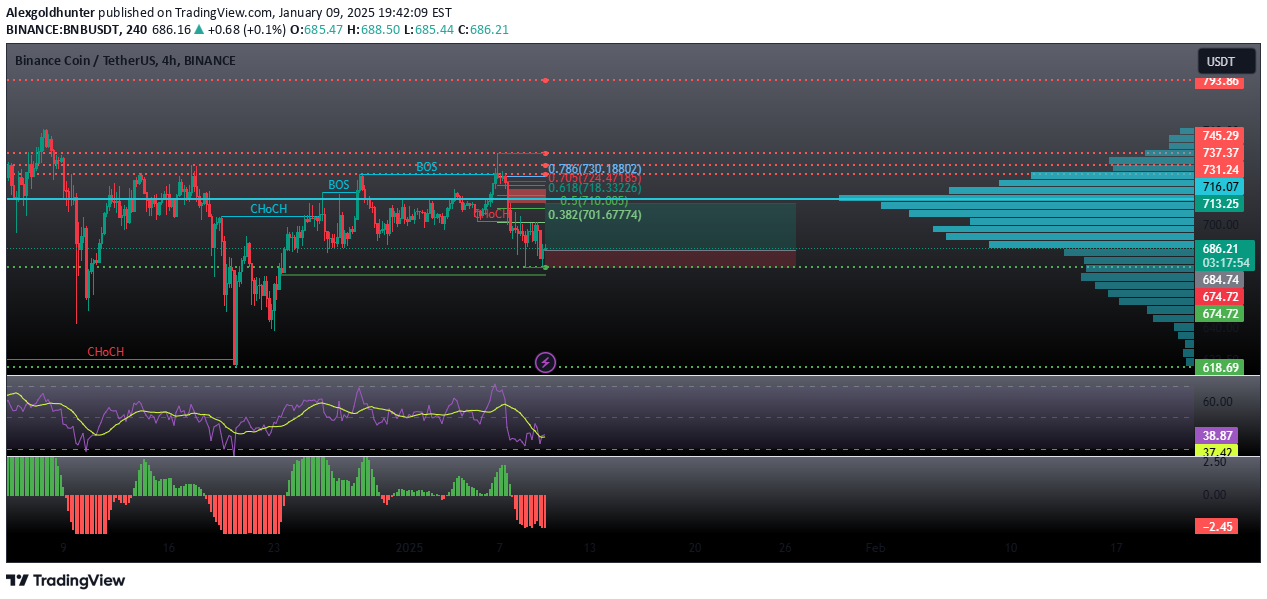
BNBUSDT BNB/USDT: Key Fibonacci and Volume Profile Reversal ZonesAnalysis:The chart provided is a 4-hour timeframe of Binance Coin (BNB) against Tether (USDT) on the Binance exchange. The chart includes several technical indicators and annotations that are crucial for formulating a trading strategy.Price Action and SMC Analysis:The chart shows multiple Change of Character (CHoCH) and Break of Structure (BOS) points, indicating shifts in market sentiment and potential reversal zones.The recent CHoCH at the right side of the chart suggests a bearish sentiment.Fibonacci Retracement Levels:Key Fibonacci levels are marked, with 0.786 (730.18802), 0.705 (728.41885), 0.618 (718.33226), and 0.382 (701.67774) being significant.The price is currently near the 0.382 level, which could act as support.Volume Profile:The volume profile on the right shows significant trading activity around 713.25 and 731.24, indicating strong resistance levels.The lower volume nodes around 687.11 and 674.72 suggest potential support zones.RSI and MACD Indicators:The RSI is currently around 39.67, indicating that the asset is approaching oversold conditions.The MACD histogram shows red bars, suggesting bearish momentum, but the green bars indicate potential bullish divergence.Buy Strategy:Entry: 687.11 (near the support level and lower volume node)Take Profit 1 (TP1): 713.25 (+261.4 pips)Take Profit 2 (TP2): 731.24 (+441.3 pips)Stop Loss (SL): 674.72 (-124.9 pips)This detailed analysis uses various trading strategies, including Price Action, Smart Money Concepts (SMC), and ICT Elliott Wave Theory. The indicators displayed on the chart, such as Fibonacci retracement levels, volume profile, RSI, and MACD, support the analysis and identify key levels for entry, take profit, and stop lossBuy Strategy: Entry: 687.11 (near the support level and lower volume node)
Alexgoldhunter
SOL/USDT: Reversal and Breakout Insights

SOLUSDT SOL/USDT: Reversal and Breakout InsightsAnalysis:The chart provided is a 4-hour timeframe of SOL/USDT on Binance, showcasing various technical indicators and patterns. The chart includes:Price Action and Trend Lines:The price has been in a downtrend, indicated by the descending channel (blue lines).There are multiple Break of Structure (BOS) and Change of Character (ChOCH) points marked, indicating potential trend reversals.Support and Resistance Levels:Key resistance levels are marked at 247.00, 225.21, 219.83, 217.05, and 216.79.Key support levels are marked at 215.16, 203.00, and 175.26.Volume Profile:The volume profile on the right shows significant trading activity around the 215.16 level, indicating a strong area of interest.Relative Strength Index (RSI):The RSI is currently at 62.55, suggesting that the asset is approaching overbought territory but still has room for upward movement.MACD Histogram:The MACD histogram at the bottom shows a recent bullish crossover, indicating potential upward momentum.Buy Strategy:Entry: Buy at the breakout above 217.05, confirming the bullish momentum.Take Profit 1 (TP1): 225.21 (next resistance level).Take Profit 2 (TP2): 247.00 (major resistance level).Stop Loss (SL): 203.00 (below the recent support level).Follow Alexgoldhunter for more strategic ideas and minds.VIP Signal:Buy: 217.05 tp1 225.21 tp2 247.00 sl 203.00This comprehensive analysis integrates multiple trading strategies, including Price Action, Smart Money Concepts (SMC), and ICT Elliott Wave Theory, to provide detailed buy and sell strategies. The chart indicators, such as RSI, MACD, and volume profile, support the analysis and identify key levels for entry, take profit, and stop loss.
Alexgoldhunter
BNB/USDT Poised for Breakout: Key Levels and Indicators to Watch

BNB BNB/USDT Poised for Breakout: Key Levels and Indicators to WatchAnalysis:Price Action Strategy:Support and Resistance Levels:The chart shows significant support at 687.75 and resistance around 701.04.Candlestick Patterns:Recent candlesticks indicate consolidation near the resistance level, suggesting a potential breakout.Smart Money Concepts (SMC):Change of Character (CHoCH):The CHoCH level is marked, indicating a potential shift in market structure from bearish to bullish.Order Blocks:The chart shows potential order blocks around the 687.75 support level, which could act as a demand zone.ICT Strategy:Fibonacci Retracement:Key Fibonacci levels are marked, with the 0.618 level at 696.39 and the 0.5 level at 701.33, indicating potential retracement targets.Indicators:Volume: Increased volume near the resistance level suggests strong buying interest.RSI: The RSI is at 55.32, indicating a neutral to slightly bullish momentum.MACD: The MACD shows a potential bullish crossover, supporting the bullish bias.Buy Strategy:Entry: Above the resistance level at 701.04, confirming a breakout.Take Profit (TP):TP1: 705.73 (0.382 Fibonacci level)TP2: 720.00 (psychological level)Stop Loss (SL): Below the support level at 687.75Sell Strategy:Entry: Below the support level at 687.75, confirming a breakdown.Take Profit (TP):TP1: 680.00 (recent low)TP2: 660.00 (next support level)Stop Loss (SL): Above the resistance level at 701.04Buy:entry: 701.04tp1: 705.73tp2: 720.00sl: 687.75Disclaimer: This analysis is for educational purposes only and should not be considered financial advice. Always do your own research before making any trading decisions.I hope this analysis helps with your trading decisions! If you have more charts to analyze or need further insights, feel free to share.Follow Alexgoldhunter for more strategic ideas and minds
Alexgoldhunter
Cardano (ADA) Poised for Breakout: Key Levels and Indicators

ADAUSDT Cardano (ADA) Poised for Breakout: Key Levels and Indicators to WatchAnalysis:Price Action Strategy:Support and Resistance Levels:The chart shows key support at approximately 0.85177 (1.618 Fibonacci level) and resistance at 0.90723 (0.5 Fibonacci level).Trend Analysis:The price is currently in a consolidation phase after a downtrend, with potential for a breakout above the 0.90723 resistance level.Volume Analysis:There is a noticeable increase in volume, indicating potential buying interest.Smart Money Concepts (SMC):Break of Structure (BOS):A BOS is identified at the 0.90723 level, suggesting a potential shift in market structure.Change of Character (CHOCH):A CHOCH is observed, indicating a possible reversal from the previous downtrend.Fair Value Gap (FVG):An FVG is present around the 0.90723 level, which could act as a magnet for price.ICT Strategy:Order Blocks:Multiple order blocks are identified, with a significant one around the 0.85177 level, indicating strong institutional interest.Equal Highs:The chart shows equal highs around the 0.90723 level, suggesting liquidity above this level.Strong Low:A strong low is identified, providing a potential support level for a bullish move.Indicators:RSI:The RSI is currently at 65.50, indicating bullish momentum but approaching overbought territory.MACD:The MACD shows a bullish crossover, supporting the potential for upward movement.Buy Signal:entry: 0.906tp1: 0.950tp2: 1.000sl: 0.875Follow Alexgoldhunter for more strategic ideas and mindsentry: 0.906SL HITCLOSE ALL TRADES
Alexgoldhunter
ETH/USD: Smart Money Concepts and Price Action Analysis

ETHUSD ETH/USD: Smart Money Concepts and Price Action Analysis for Optimal EntriesAnalysis:Price Action Strategy:Support and Resistance Levels:Key support level at approximately 3,316.6 USD.Key resistance level at approximately 3,387.5 USD.Trend Analysis:The chart shows a recent downtrend with multiple Break of Structure (BOS) and Change of Character (CHoCH) indicating potential reversals.The price is currently testing an Order Block (OB) around 3,370.6 USD, suggesting a potential buy opportunity if the price holds above this level.Smart Money Concepts (SMC):Order Blocks (OB):A bullish OB is identified around 3,370.6 USD, indicating a potential buy zone.A bearish OB is identified around 3,387.5 USD, indicating a potential sell zone.Break of Structure (BOS) and Change of Character (CHoCH):Multiple BOS and CHoCH are marked, indicating shifts in market structure and potential entry points.ICT Strategy:Fibonacci Retracement Levels:Key Fibonacci levels are marked: 0.382 (3,357.0 USD), 0.618 (3,324.1 USD), 0.705 (3,403.7 USD), and 0.786 (3,415.5 USD).The price is currently near the 0.382 level, suggesting a potential retracement and buy opportunity.Volume Profile:High volume nodes around 3,380.6 USD and 3,370.6 USD indicate significant trading activity and potential support/resistance zones.Indicators:RSI:RSI is currently around 49.00, indicating neutral momentum but potential for a bullish reversal if it moves above 50.MACD:MACD shows a potential bullish crossover, suggesting a buy signal if confirmed.Buy Opportunity:entry: 3370.6tp1: 3387.5tp2: 3415.5sl: 3316.6Follow Alexgoldhunter for more strategic ideas and mindsTP1 HIT SUCCESSFULLYTP2 HIT SUCCESSFULLY
Disclaimer
Any content and materials included in Sahmeto's website and official communication channels are a compilation of personal opinions and analyses and are not binding. They do not constitute any recommendation for buying, selling, entering or exiting the stock market and cryptocurrency market. Also, all news and analyses included in the website and channels are merely republished information from official and unofficial domestic and foreign sources, and it is obvious that users of the said content are responsible for following up and ensuring the authenticity and accuracy of the materials. Therefore, while disclaiming responsibility, it is declared that the responsibility for any decision-making, action, and potential profit and loss in the capital market and cryptocurrency market lies with the trader.