
AlexeyWolf
@t_AlexeyWolf

What symbols does the trader recommend buying?
Purchase History
پیام های تریدر
Filter
AlexeyWolf
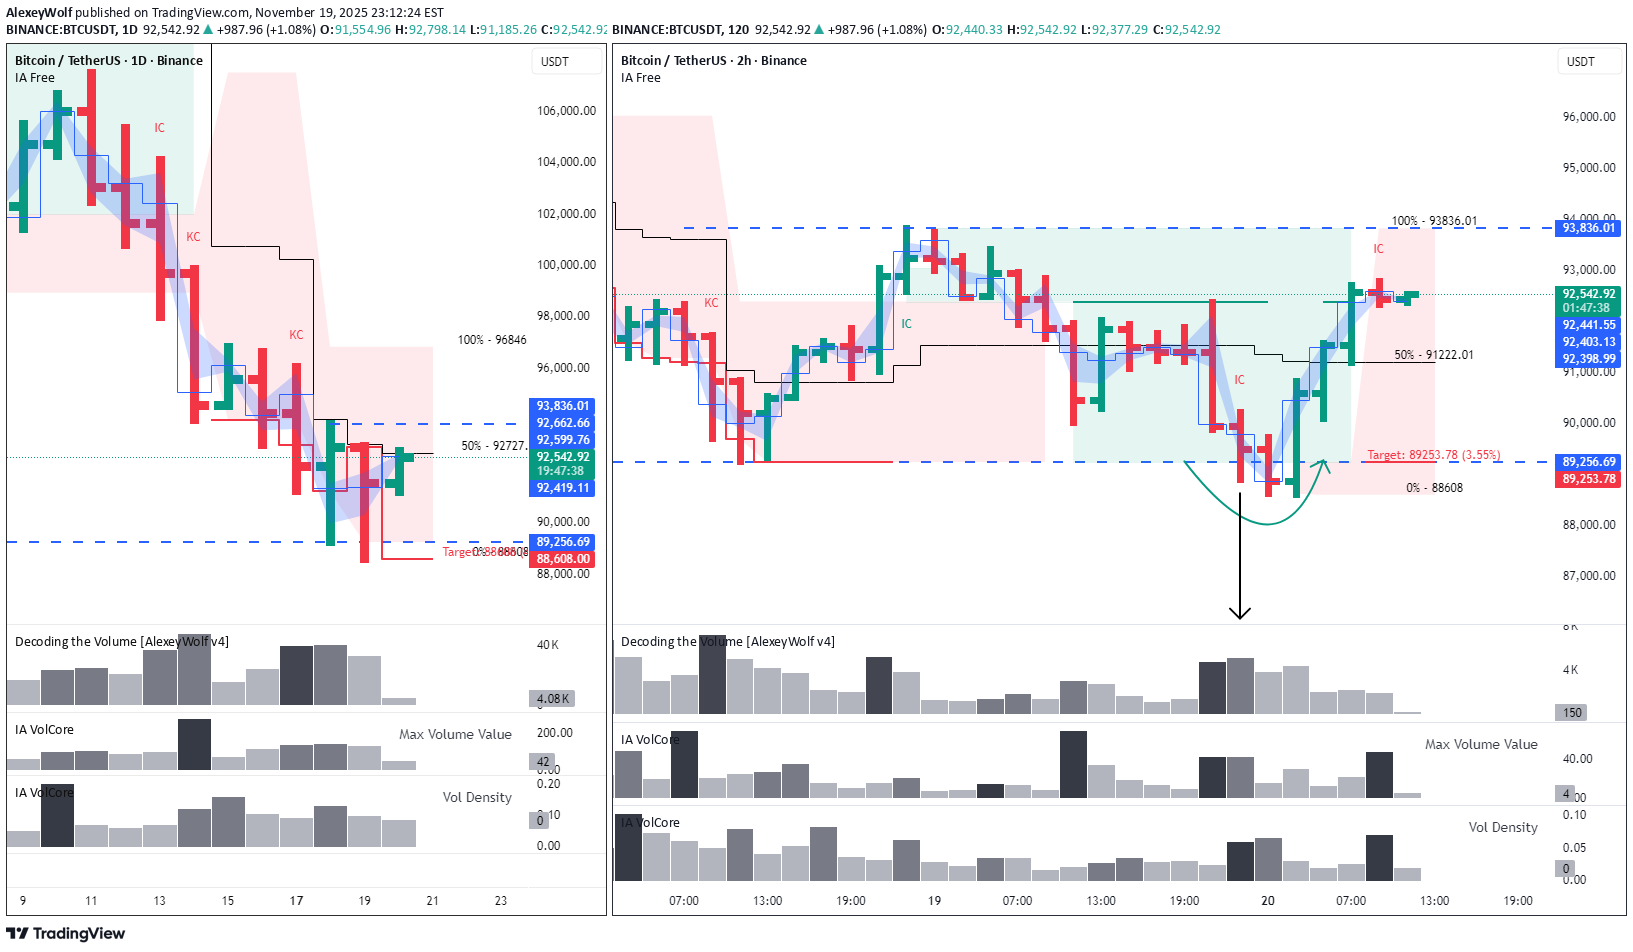
BTC at the upper boundary: mixed signals
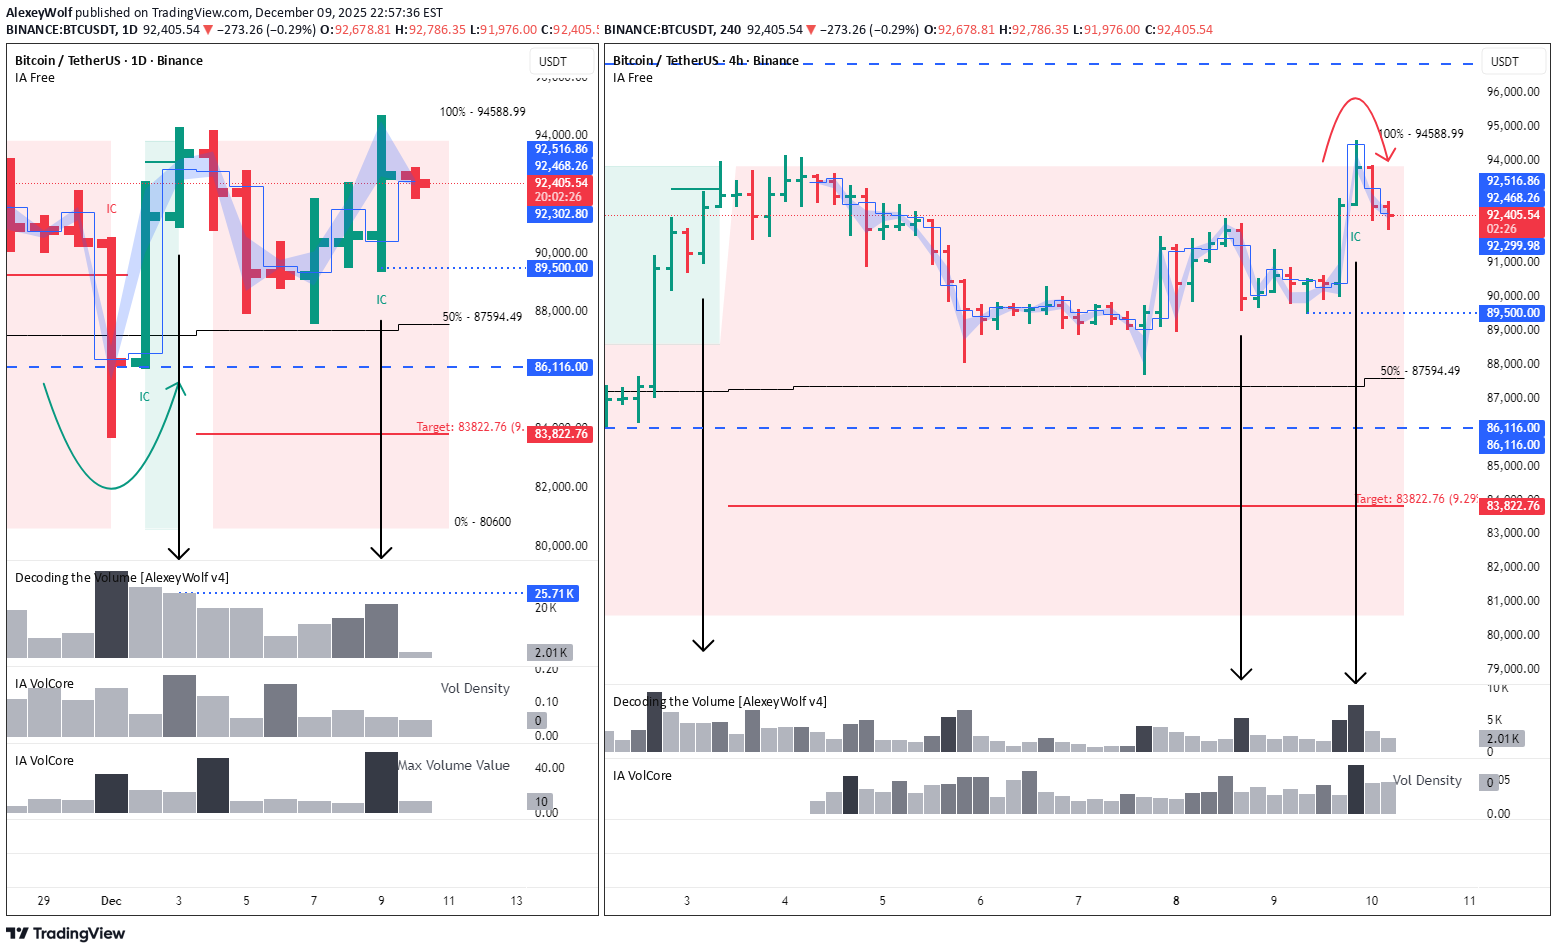
This analysis is based on the Initiative Analysis (IA) method. Hello traders and investors! On the 4-hour timeframe, an absorption pattern has formed at the upper boundary of the range. At the same time, a buyer zone begins immediately below, where a buyer reaction may appear. On the daily timeframe, the structure remains within the same sideways range. The touch of the upper boundary came on a volume spike, and key volume was accumulated in the upper part of the range — which is a positive sign. However, this daily candle has two details that raise questions: First: the highest volume was accumulated around 90,400, not at the top of the candle. Second: despite the volume spike, it was still lower than the volume during the previous touch of the upper boundary, when the buyer showed initiative. Therefore, if considering a short here, I would do so only after a break below 89,500 and confirmation that the seller is defending this level. For now, the stance is neutral: observing how the structure develops on the 1-hour and 4-hour timeframes. Wishing you profitable trades!
AlexeyWolf
ساختار هفتگی بیت کوین: حجمها چه رازی از بازار فاش میکنند؟
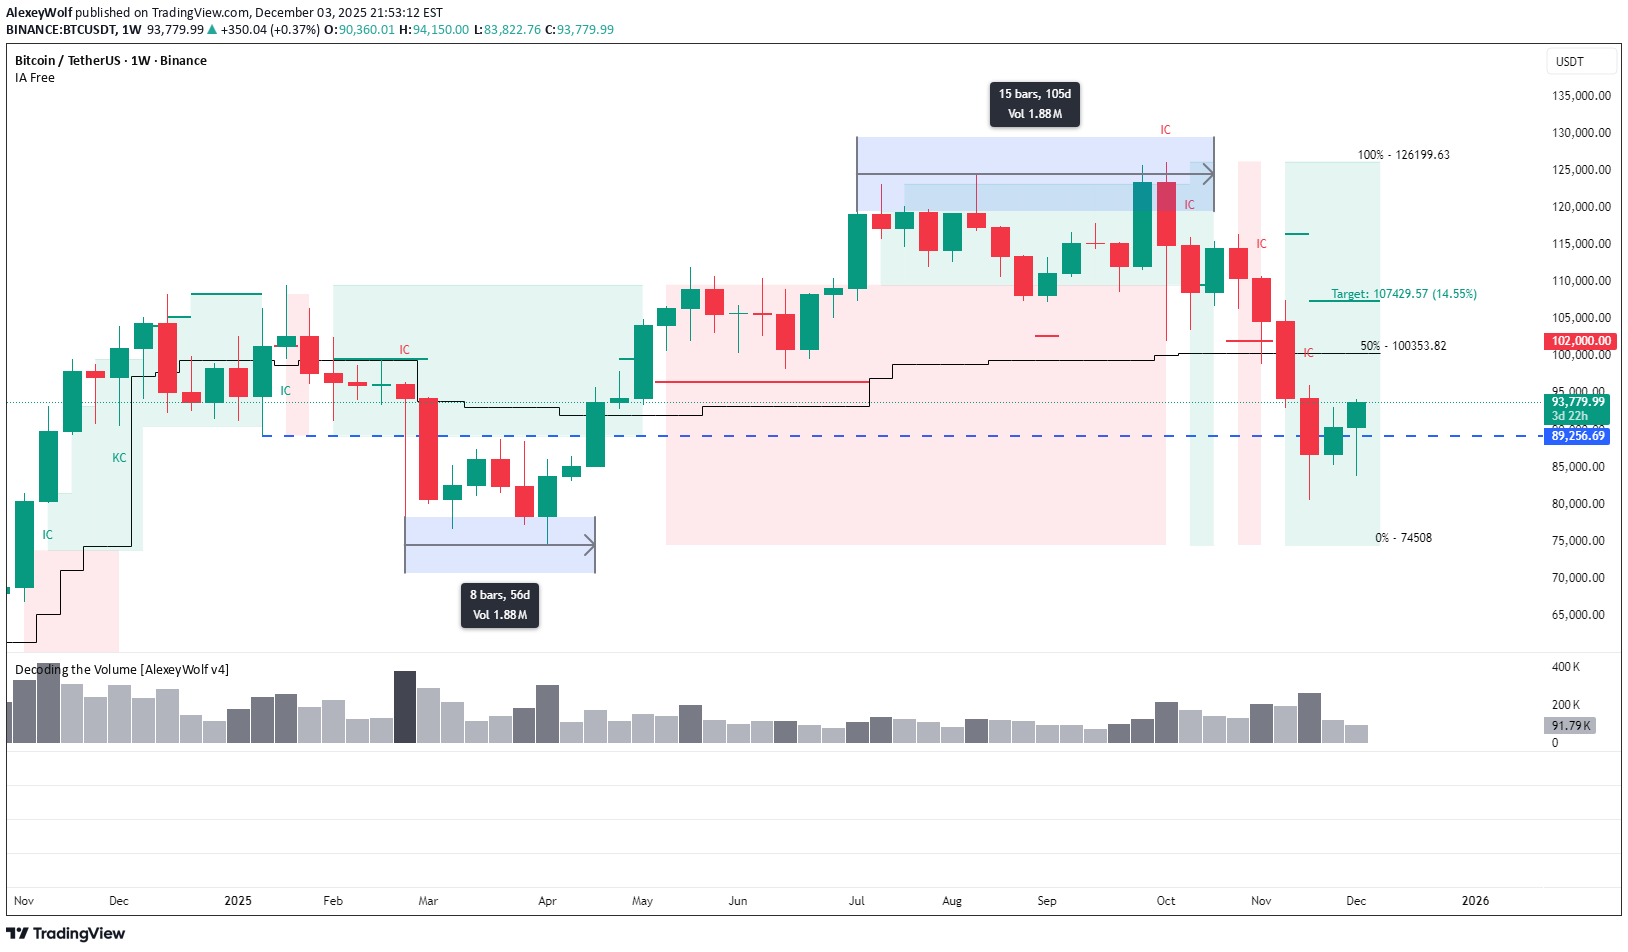
This analysis is based on the Initiative Analysis (IA) method. Hello traders and investors! On the weekly timeframe, Bitcoin remains in a sideways range. Notice how interestingly the price moved through its boundaries. First, the lower boundary of the range at 89,256 was broken — and this is where a 1.88M volume was accumulated over 8 weeks . Later, the price broke the upper boundary of the range, and the same 1.88M volume was distributed, but this time over just 15 days . This indicates that there were far fewer buyers willing to buy at higher prices — the market needed almost twice as much time to distribute an identical volume. Now the price has returned to the very zone where the first major volume was accumulated. For more details about the 86,000–79,500 zone, see the related post. Wishing you profitable trades!
AlexeyWolf
خریداران BNB دوباره قفسه پایینی را پس گرفتند: سطوح کلیدی حمایت و اهداف بعدی
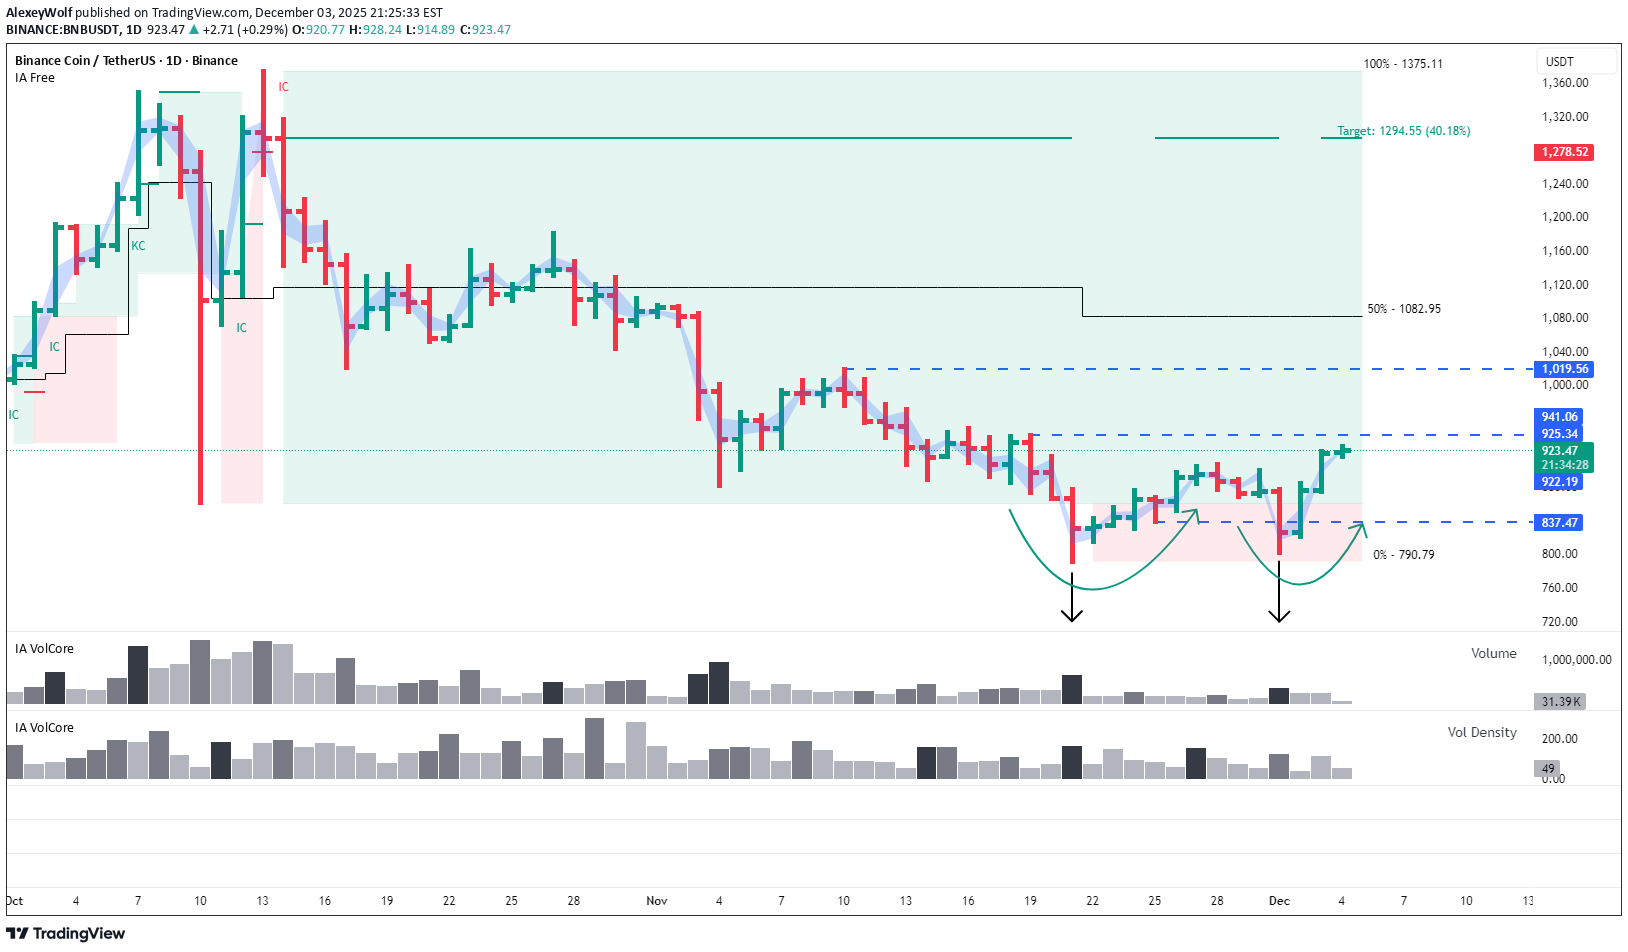
This analysis is based on the Initiative Analysis (IA) method. Hello traders and investors! A reminder: the daily timeframe is still in a sideways range. At its lower boundary, another false-break pattern has formed — this time at the 837 level: a seller’s attack on high volume followed by a confident absorption by buyers. The nearest targets remain the same: 941 and 1019. Wishing you profitable trades!
AlexeyWolf
بیت کوین به هدف روزانه رسید: آیا قیمت به ۹۷,۰۰۰ دلار صعود میکند؟
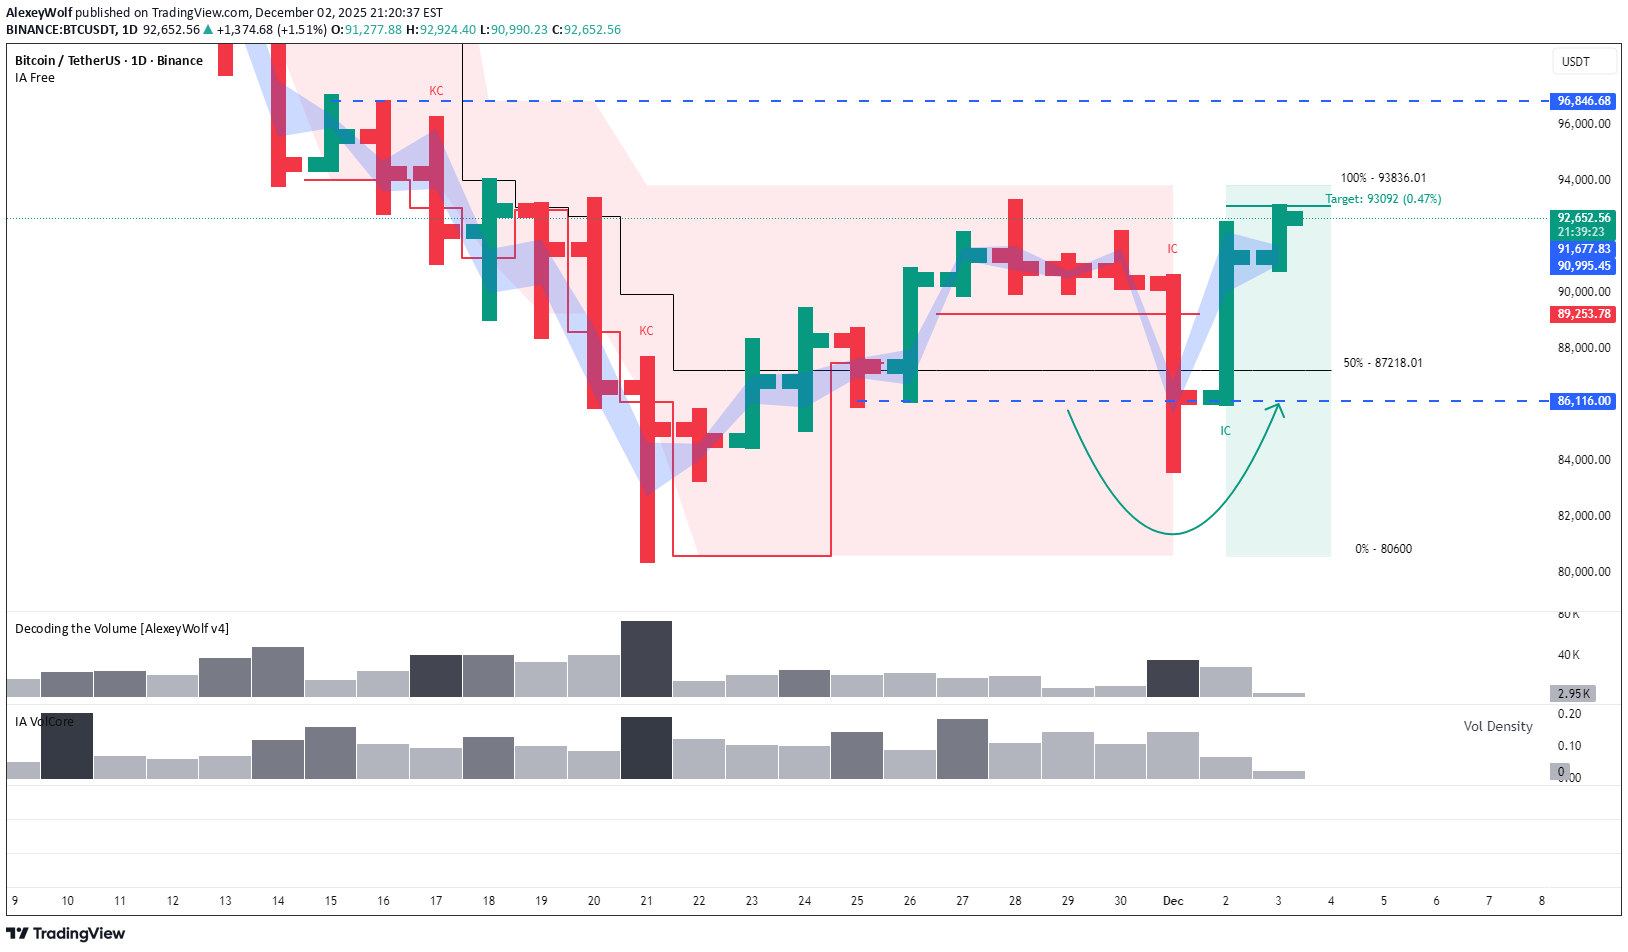
This analysis is based on the Initiative Analysis (IA) method. Hello traders and investors! On the daily timeframe, Bitcoin has formed another confident buyer absorption — and this absorption was simultaneously a manipulation (a false breakout) of the 86,116 level. Notably, the seller’s candle appeared with increased volume, and the subsequent absorption created a new buyer zone. The buyer target within the current range — 93,092 — is almost reached. Given the strength of buyer initiative, further movement toward 94,000 or even 97,000 cannot be ruled out. However, once the price reaches 93,092, it is reasonable to expect seller initiative. This is classic market behavior near a target: some buyers take profit while sellers get an opportunity to step in. Wishing you profitable trades!
AlexeyWolf
بیت کوین به محدوده بازگشت! آیا خریداران پیروز میشوند؟ (تحلیل حرکت قیمت و سطوح کلیدی)
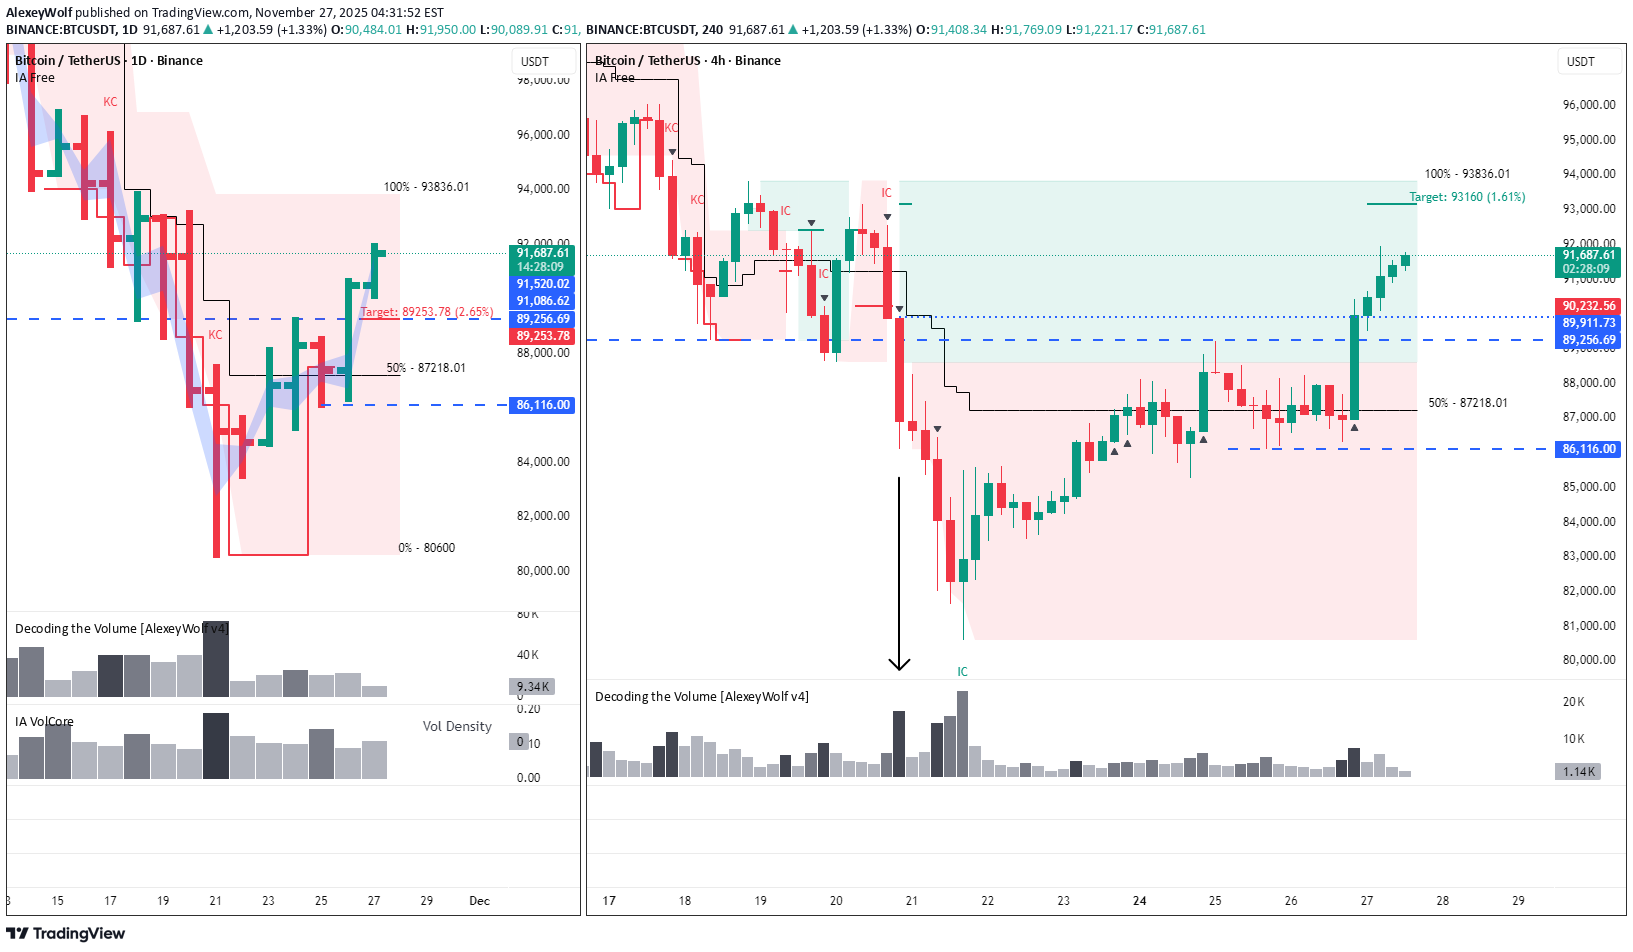
This analysis is based on the Initiative Analysis (IA) method. Hello traders and investors! On the 4-hour timeframe, the buyer has brought the price back into the range and absorbed the seller’s attack bar at the lower boundary. A buyer initiative is developing on the 4H chart, with a target at 93,160. It’s possible that buyers will manage to break the upper boundary of the range, which is currently at 93,836. On the daily timeframe, the price touched the 89,256 level, and a new range is starting to form. Within this range, the nearest seller target is 89,253. Key levels for potential long setups are buyer defenses at 89,253 and 86,116. Sellers can look for short setups if the upper boundary of the range is defended by the seller on the 4-hour timeframe, with a target at 89,256. Wishing you profitable trades!
AlexeyWolf
خرید بیتکوین (BNB) در اولویت: استراتژی صعودی با این اهداف مشخص!
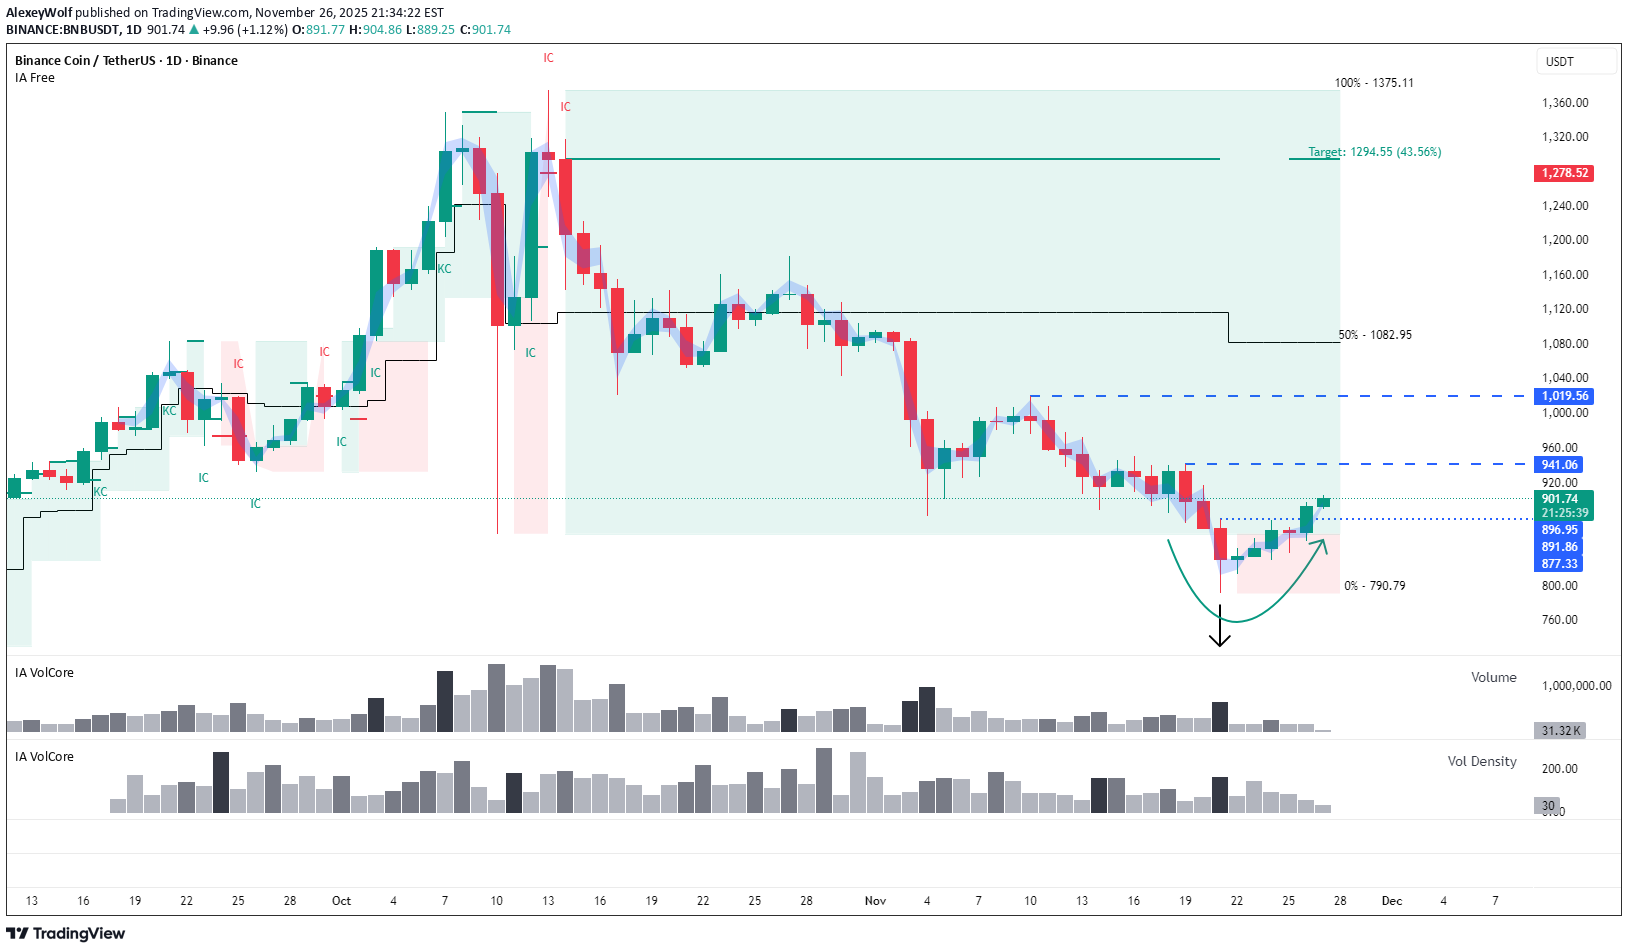
Buyers may still show strength despite the lack of interaction with a key level. This analysis is based on the Initiative Analysis (IA) method. Hello traders and investors! On the daily timeframe, the market is in a sideways range, and a false-break pattern of the lower boundary has formed. We see a seller’s attack on volume at the level, followed by a bullish absorption of the attack candle. There is one detail: during the formation of this pattern, the price stopped roughly 11 dollars short of the 50% level of the monthly trading range. Even with this nuance, the long scenario remains valid. The first target is 941. Wishing you profitable trades!
AlexeyWolf
بیت کوین در آستانه صعود؟ حمایت خریداران تثبیت شد و هدف کجاست؟
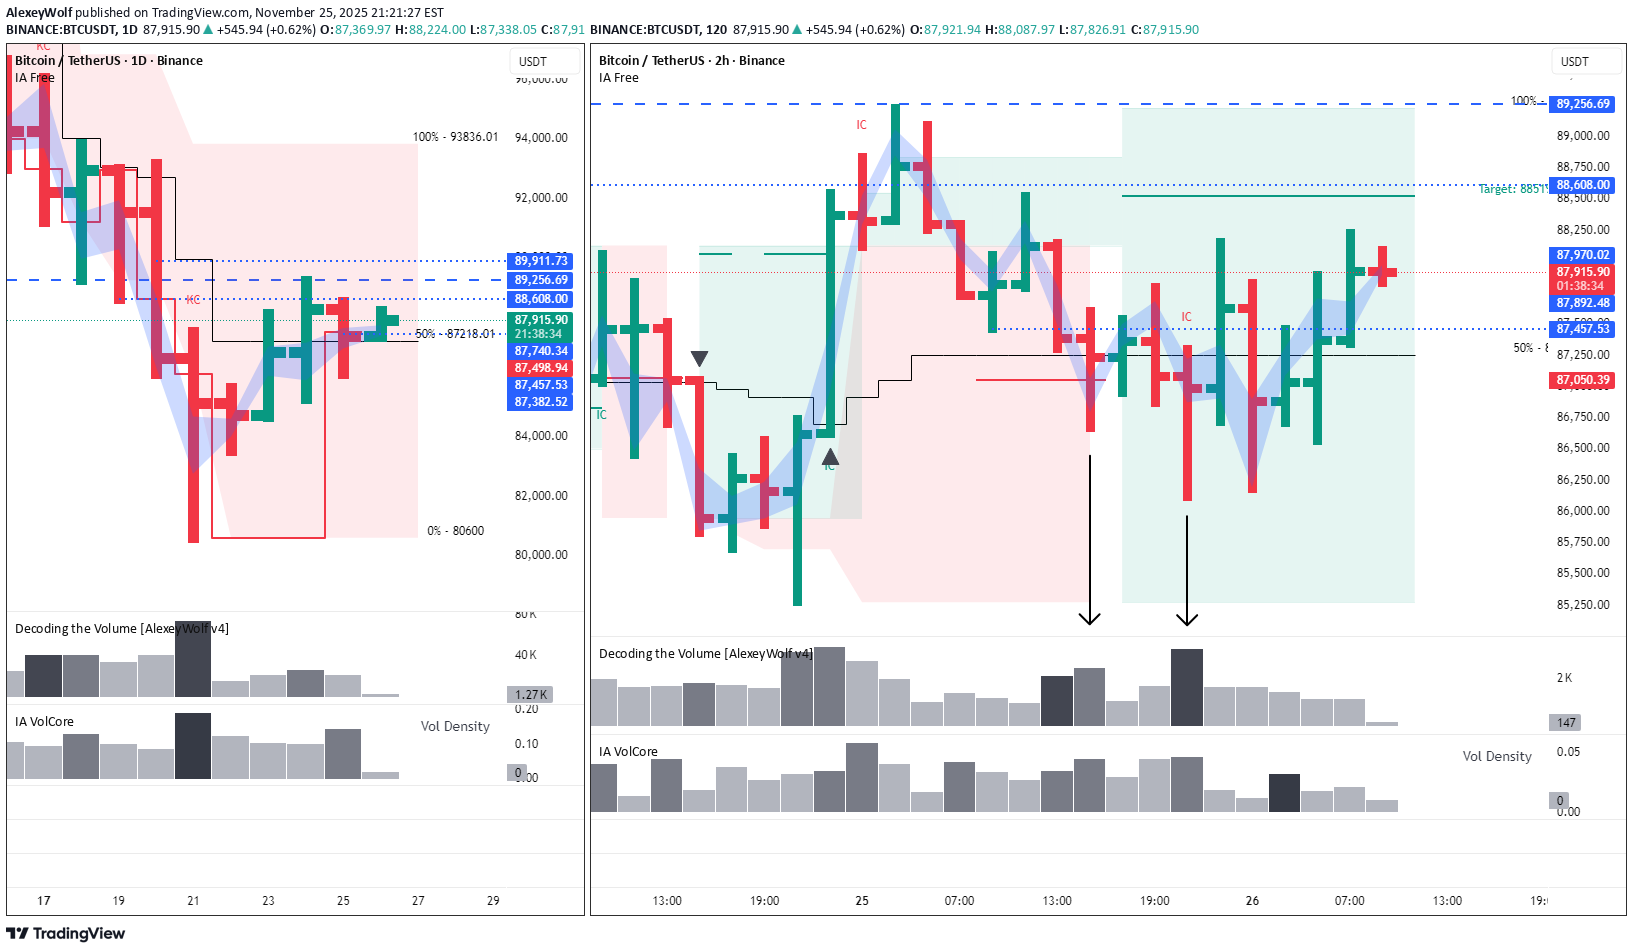
Daily buyer zone shows a successful test; 2H chart points to active buyer initiative with a target at 88,519. This analysis is based on the Initiative Analysis (IA) method. Hello, traders and investors! On the daily timeframe, a buyer zone has formed at the end of the seller initiative. Yesterday, this buyer zone was tested by a seller bar on declining volume, which looks more like a test rather than active selling. On the 2-hour timeframe, we have a sideways range with an active buyer initiative, and the nearest target is 88,519. Yesterday, the seller attempted to push the price lower on increased volume, but the move stalled within the key volume area (87,000–86,000) of the daily buyer candle — the candle that formed the buyer zone on the daily chart. Wishing you profitable trades!
AlexeyWolf
بیت کوین در منطقه خرید حیاتی: آیا کف جدید تشکیل میشود؟ (تحلیل 86,000 تا 79,500 دلاری)
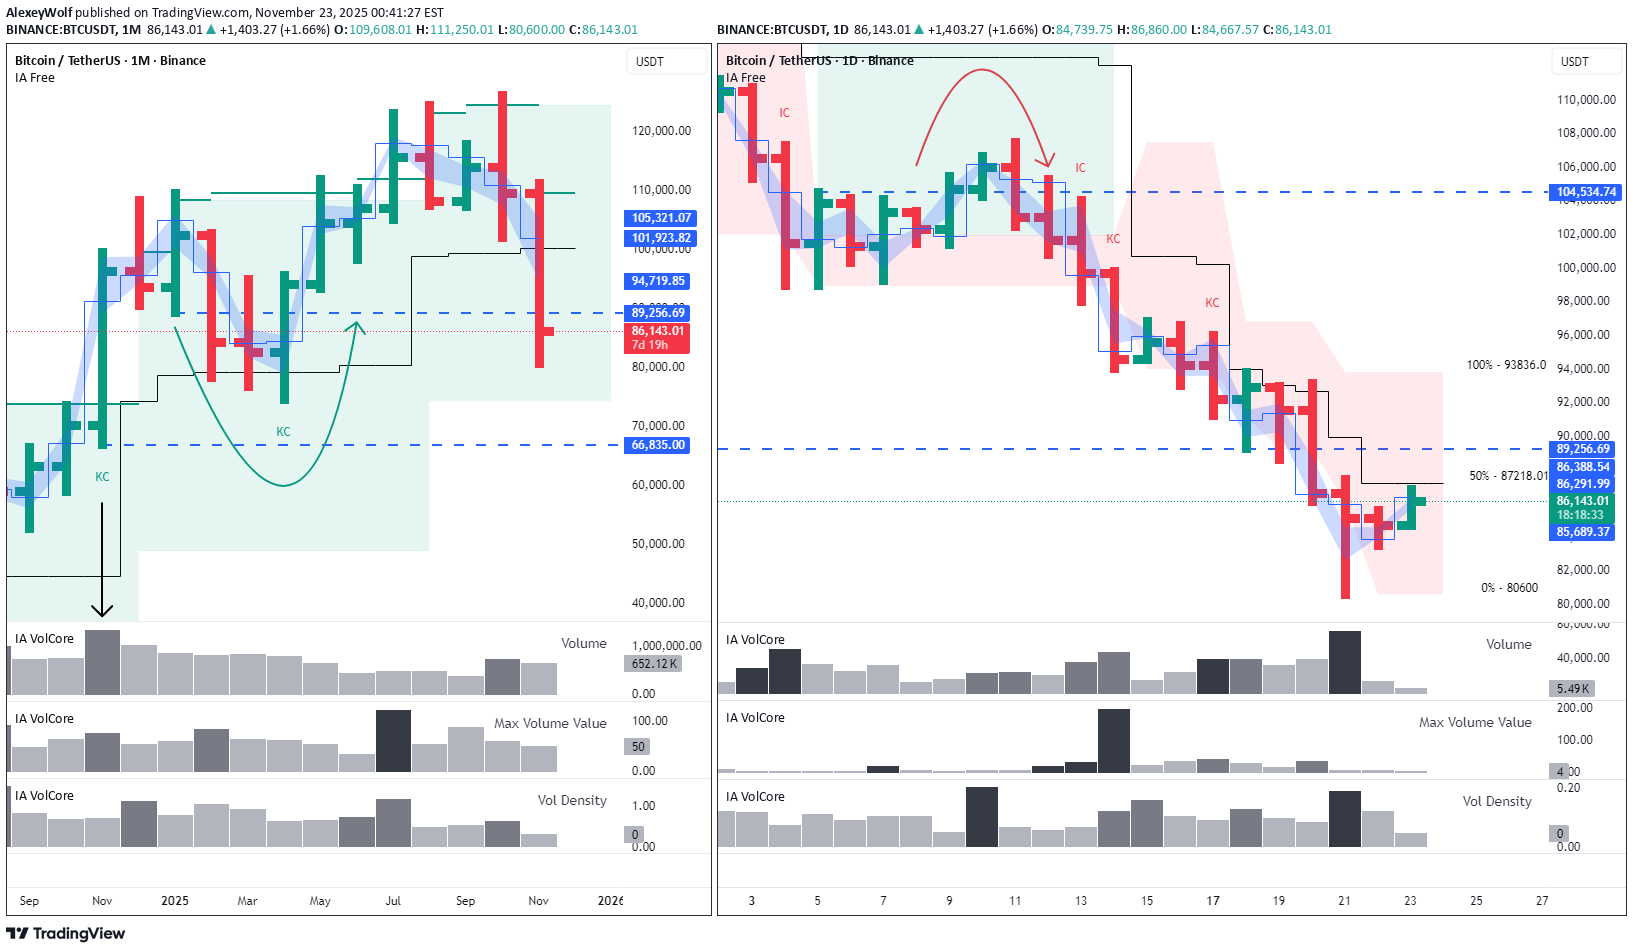
This analysis is based on the Initiative Analysis (IA) method. Hello, traders and investors! On the monthly timeframe, the last buyer candle with increased volume appeared a year ago — in November 2024. From that point, buyers attempted to resume the trend twice. The first attempt — in January — formed the level 89,256. The second attempt came after a manipulation of the 89,256 level between February and April 2025. This led to the formation of a new buyer initiative with: — upper boundary at 126,199, — lower boundary at 74,508. The current buyer target from this initiative is 109,608. Now the price has returned to the volume accumulation zone created during that manipulation — the 86,000–79,500 range. The blue band on the chart marks the minimal price range where 50% of the candle’s volume was accumulated. The blue line marks the price of the maximum volume inside that candle. The daily candle from 21.11 has entered the 86,000–79,500 range with the largest volume since April 2025. (And April 2025 was exactly when the 89,256 level manipulation took place.) This confirms buyer interest in this price zone. This daily candle is part of the forming seller initiative. The upper boundary of this seller initiative is 93,836, while the lower boundary is not yet defined, as the seller move has not been stopped by a buyer candle. Any market scenario remains possible. With strong seller pressure, the price may fall below 74,508 (lower boundary of the monthly buyer initiative) or even below 66,835 (the low of the November 2024 buyer candle). A consolidation phase is also possible — and even the most likely — but for that, we first need to see a buyer candle, followed by a return to 89,256 or higher. We continue to monitor the situation. Wishing you profitable trades!
AlexeyWolf
بیت کوین در آستانه بازگشت؟ علائم اولیه تغییر مسیر نزولی BTC
The 89,256 level has slowed down Bitcoin’s decline. Hello, traders and investors! This analysis is based on the Initiative Analysis (IA) method. First, price interacted with the level through a buyer candle with strong volume, and then again through a seller candle with declining volume on the daily timeframe. On the 2-hour timeframe, the second interaction with this level turned out to be a manipulation of the lower boundary of the range that has formed on 2H. The target of that manipulation has already been reached, but we may still see price move toward 93,836. Reaching this level would be a good signal that at least a temporary pause in the downtrend is forming — and possibly the early stage of a reversal, although likely a slow one. Wishing you profitable trades!
AlexeyWolf
بیت کوین در آستانه 89,256: سیگنال فروش صادر شد!
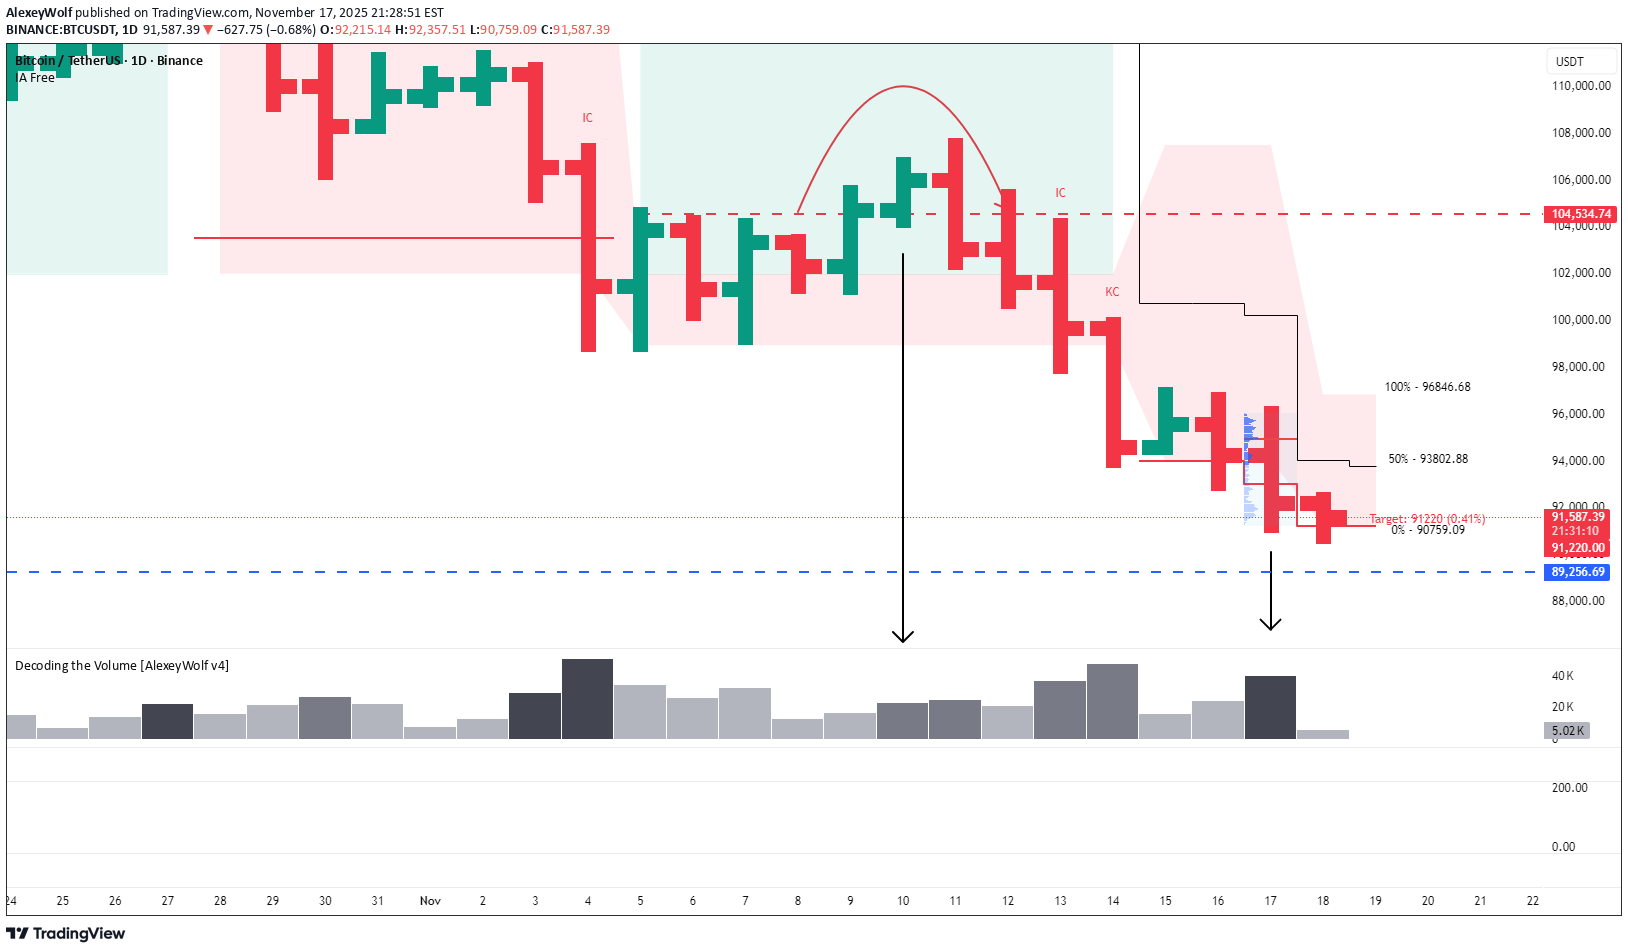
Hello, traders and investors! This analysis is based on the Initiative Analysis (IA) method. Bitcoin’s price is getting closer to the 89,256 level. Yesterday, November 17, the daily candle closed as a seller candle. The volume was accumulated in the upper part of the candle, and the candle itself showed increased volume. In this configuration, a continuation of the seller’s move is quite likely. Wishing you profitable trades!
Disclaimer
Any content and materials included in Sahmeto's website and official communication channels are a compilation of personal opinions and analyses and are not binding. They do not constitute any recommendation for buying, selling, entering or exiting the stock market and cryptocurrency market. Also, all news and analyses included in the website and channels are merely republished information from official and unofficial domestic and foreign sources, and it is obvious that users of the said content are responsible for following up and ensuring the authenticity and accuracy of the materials. Therefore, while disclaiming responsibility, it is declared that the responsibility for any decision-making, action, and potential profit and loss in the capital market and cryptocurrency market lies with the trader.