
Alessiocalabretta
@t_Alessiocalabretta

What symbols does the trader recommend buying?
Purchase History
پیام های تریدر
Filter
Alessiocalabretta

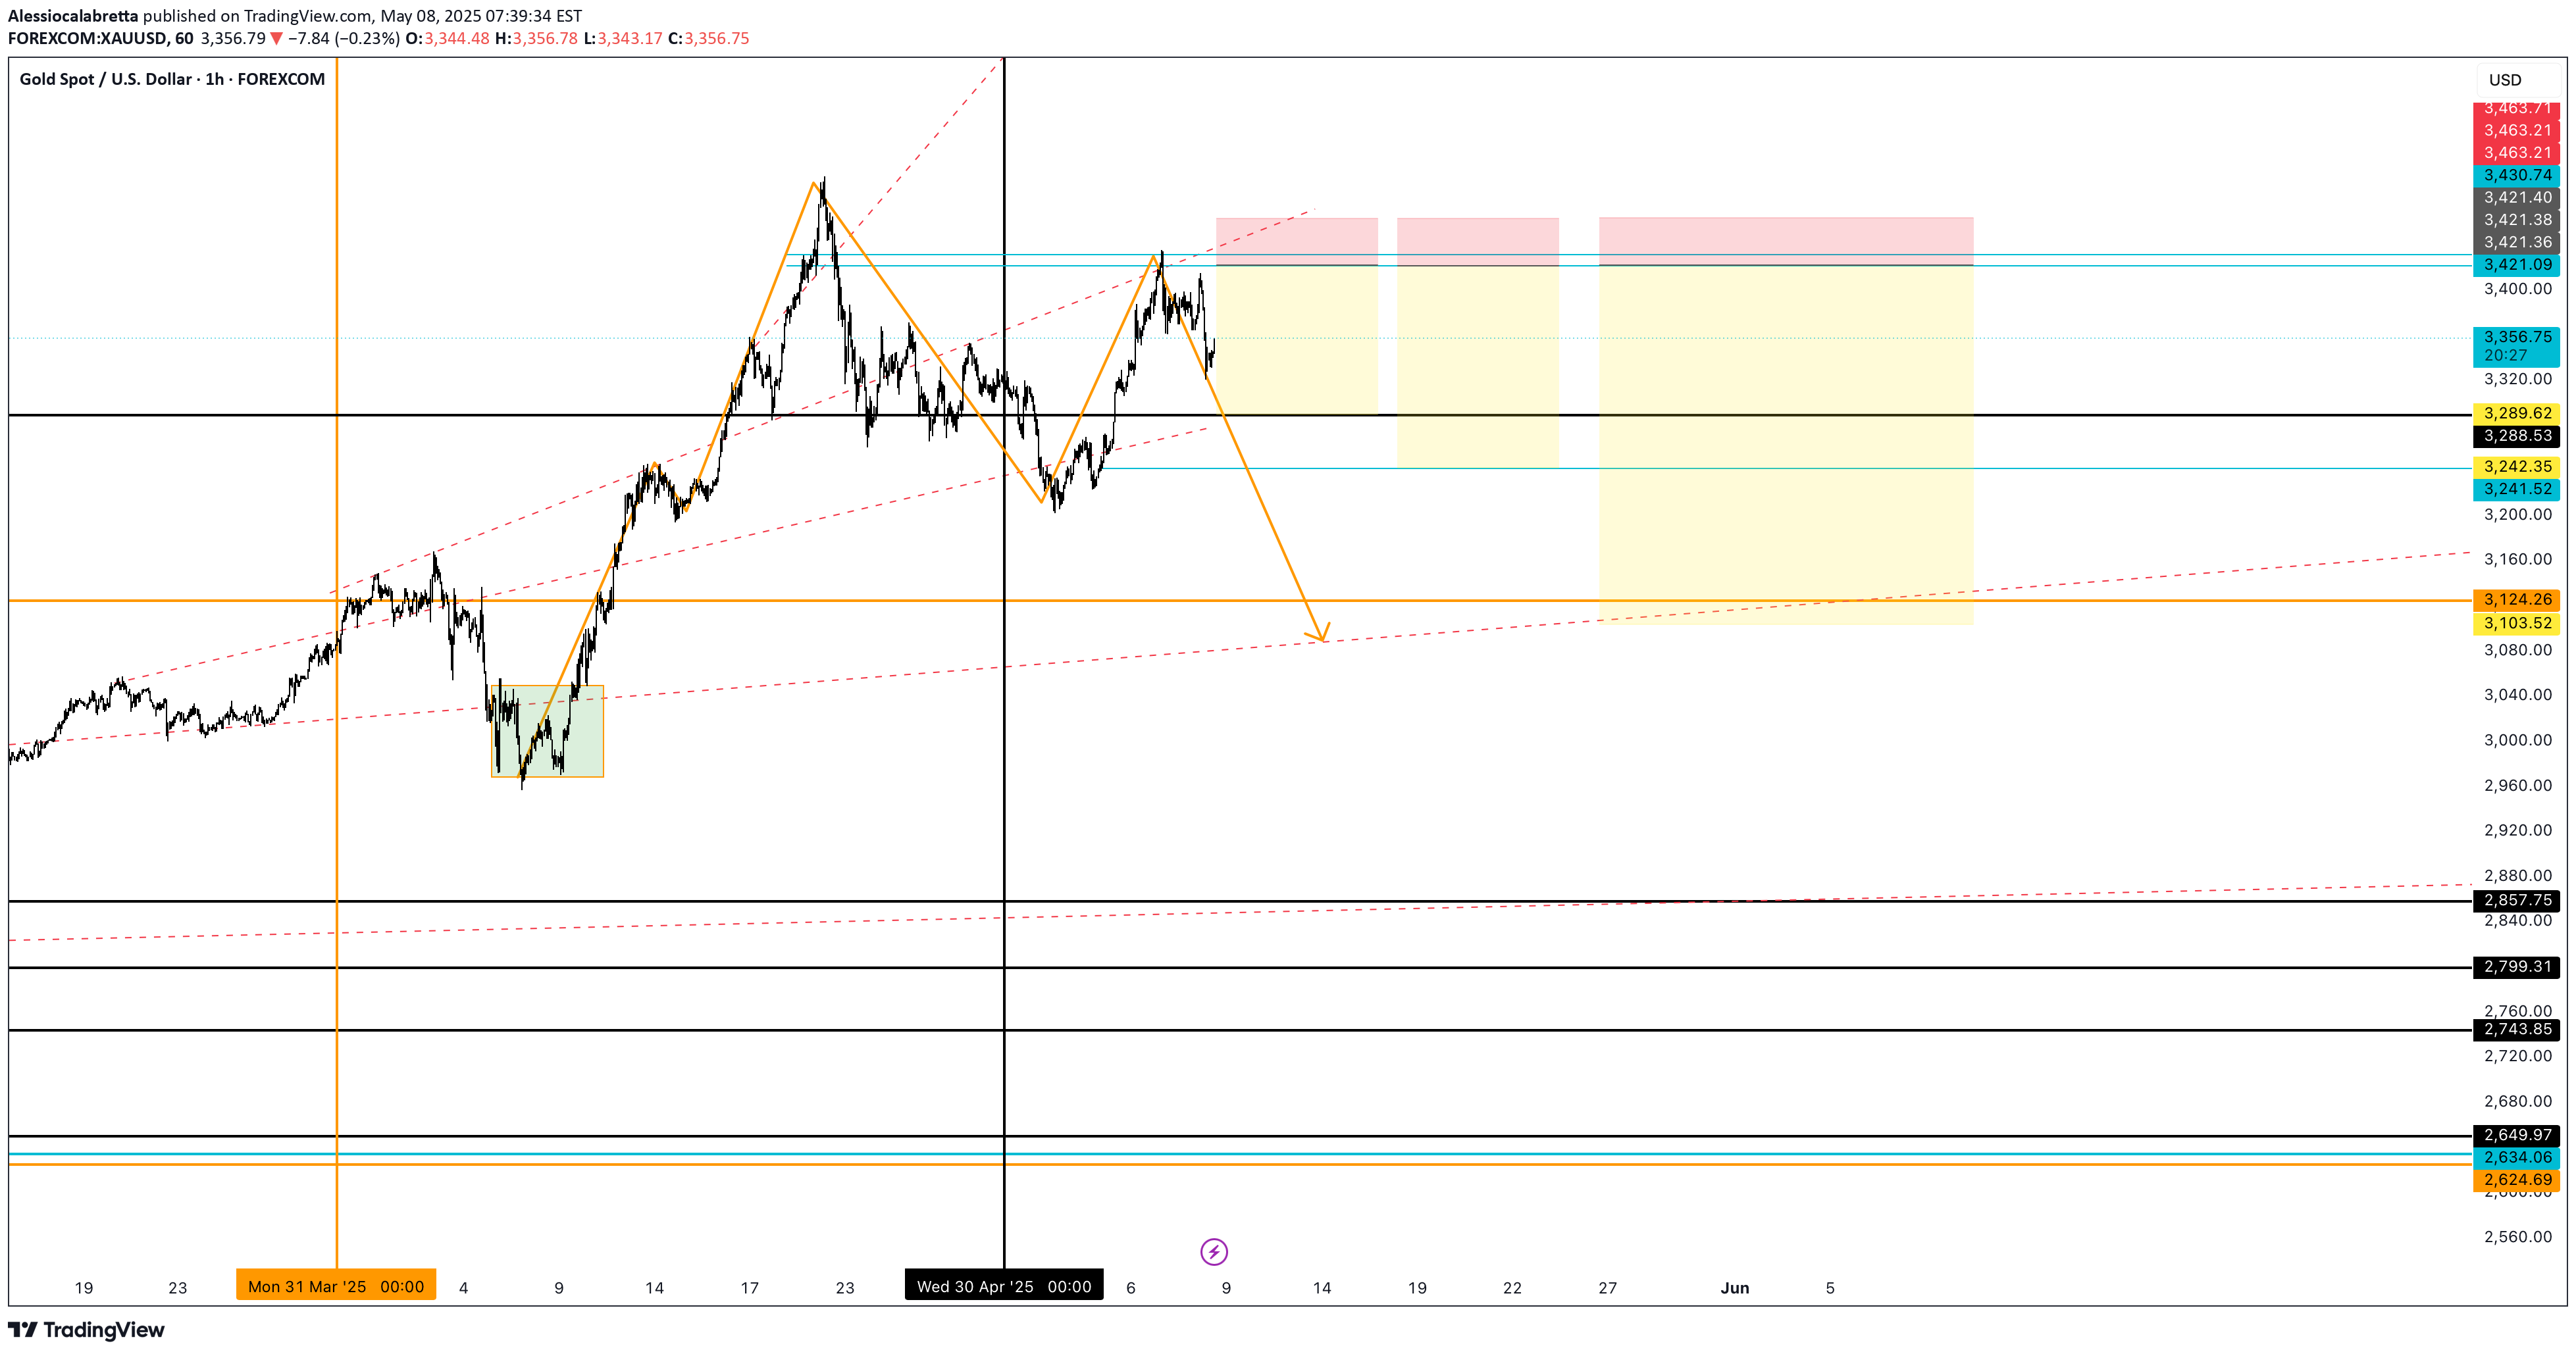
🟡 GOLD (XAUUSD) Analysis Update – May 13, 2025Initial setup published on May 8:Main bias: Bearish from the resistance level at 3421Targets:🎯 1st target: 3288 🎯 2nd target: 3250🎯 3rd target: 3124🔍 Current Situation:Price is bouncing off last week's weekly low (red line at 3241).A technical rebound up to the 3285 area is possible, which could act as a retest before a continuation to the downside.The downtrend that started on May 7 is still in play, but a daily close below 3241 is needed to confirm continuation towards 3124.📌 Key Levels to Monitor:Main resistance: 3421Intermediate zones: 3288 / 3250Critical support levels:3241 (weekly low – confirmation for further downside if broken)3124 (extended target if breakdown occurs)🧭 Possible Strategies:Aggressive short entry on rejection around 3285, with a stop above 3295–3300More conservative short if there's a confirmed break and close below 3241
Alessiocalabretta

📈 BTC/USD Technical Analysis – Bullish Trend with Continuation SetupThe image represents the weekly chart of Bitcoin (BTC/USD) and clearly shows a structurally bullish trend. After a strong upward movement that pushed the price beyond the psychological threshold of $100,000, a technical correction followed, which found solid support in the $72,000–$73,000 area — a level that previously acted as strong resistance and has now turned into support.🗓️ Cyclical Aspect: April Close and Monthly SetupThe month of April, historically a key cyclical month for Bitcoin, closed strongly above the $93,000 level, which is highlighted in the chart as a crucial price/time level to understand bullish dynamics.This monthly close strengthens the market’s bullish outlook:April closed above $93,000 → a sign of structural strength.The most recent weekly close also confirmed a hold above this level, supporting the hypothesis of a continued upward trend.🚀 Projection: Breakout of $108,000 and Future TargetThe current all-time high is located around $108,000.A confirmed breakout above this level could trigger a new bullish leg toward the next key target at approximately $134,000, in line with the price extensions shown on the chart.📊 Key Technical ElementsCyclical time zones are marked by vertical blue and orange lines, indicating key phases in the market.Measured retracements and rallies with percentages and key technical levels (support/resistance).Green and red arrows indicate significant cycle lows and highs.✅ ConclusionThe current structure of Bitcoin remains strong and bullish.The fact that the price closed both the month of April and the most recent week above the $93,000 level — a strategic price/time level — serves as additional confirmation of the uptrend’s strength.A breakout above the all-time high of $108,000 could lead to a new upward leg toward $134,000.However, if the price were to fall back below $93,000 and confirm a weekly close under that level, we could see a phase of consolidation rather than immediate continuation of the rally.As long as the price holds above $93,000 on a weekly basis, the bullish scenario remains valid.
Alessiocalabretta

📈 BTC/USD Technical Analysis – Bullish Trend with Continuation SetupThe image represents the weekly chart of Bitcoin (BTC/USD) and clearly shows a structurally bullish trend. After a strong upward move that pushed the price beyond $100,000, a technical correction followed, which found solid support in the $72,000–$73,000 area — a previously strong resistance level that has now turned into support.🗓️ Cyclical Aspect: April Close and Monthly SetupApril, historically a significant month in Bitcoin's cycle, closed bullishly and above the key $93,000 level, which is highlighted in the chart as a crucial price/time zone.This reinforces the underlying strength of the uptrend, as:The monthly close above $93,000 confirms bullish momentum.The recent weekly close also held above this level, strengthening the case for a potential continuation to the upside.🚀 Projection: Breakout of $108,000 and Future TargetThe current all-time high sits around $108,000.A confirmed breakout above this resistance could trigger a strong price acceleration toward the projected target of approximately $134,000, in line with the price extensions shown on the chart.📊 Key Technical ElementsCyclical time zones indicated by vertical blue and orange lines.Measured retracements and rallies with percentages, key support/resistance zones, and highlighted accumulation/consolidation areas.Green and red arrows mark strategic lows and highs in the market cycle.✅ ConclusionThe current structure remains strong and bullish. The fact that both the monthly and weekly closes held above the $93,000 level — a significant price/time level — provides further confirmation of the bullish momentum. If Bitcoin breaks through the $108,000 all-time high, a new leg up toward $134,000 is likely, supported by strong market structure and favorable cyclical conditions.
Alessiocalabretta
he image you provided is a technical analysis of Gold (XAU/USD) on the 15-minute timeframe from TradingView. It clearly reflects a bearish (short) outlook for the coming weeks, potentially lasting until the end of May 2025. Here's a detailed breakdown:🔍 Technical ContextGold reached a high around 3,500, followed by a correction that revisited the 3,421 level, creating a strong resistance zone (likely due to liquidity grabs and profit-taking).From there, the chart shows a potential reversal structure, with expectations of a downward move.🔻 Bearish Scenario (Short)The final target for this bearish move is in the 3,124–3,078 area, which represents a key liquidity zone (highlighted with dashed lines and orange horizontal levels).Before reaching that, the price might test several intermediate support zones:3,2883,2413,124The current pattern suggests that after a strong upward impulse, the market is now likely taking a breather, possibly influenced by strength in the equity markets, which reduces gold's appeal as a safe haven in the short term.📅 Expected TimeframeThis downward move is expected to unfold by the end of May 2025, as indicated by the vertical time markers on the chart (one marking May 15th).📈 Additional ObservationsThere's a red-green box on the chart indicating the risk/reward zone for the short entry.The previous bullish trend is marked by clear impulse and correction waves, but the current price action shows loss of momentum and possible reversal signs.
Disclaimer
Any content and materials included in Sahmeto's website and official communication channels are a compilation of personal opinions and analyses and are not binding. They do not constitute any recommendation for buying, selling, entering or exiting the stock market and cryptocurrency market. Also, all news and analyses included in the website and channels are merely republished information from official and unofficial domestic and foreign sources, and it is obvious that users of the said content are responsible for following up and ensuring the authenticity and accuracy of the materials. Therefore, while disclaiming responsibility, it is declared that the responsibility for any decision-making, action, and potential profit and loss in the capital market and cryptocurrency market lies with the trader.