
Ahmad_Fxbeast
@t_Ahmad_Fxbeast
What symbols does the trader recommend buying?
Purchase History
پیام های تریدر
Filter
Signal Type

Ahmad_Fxbeast
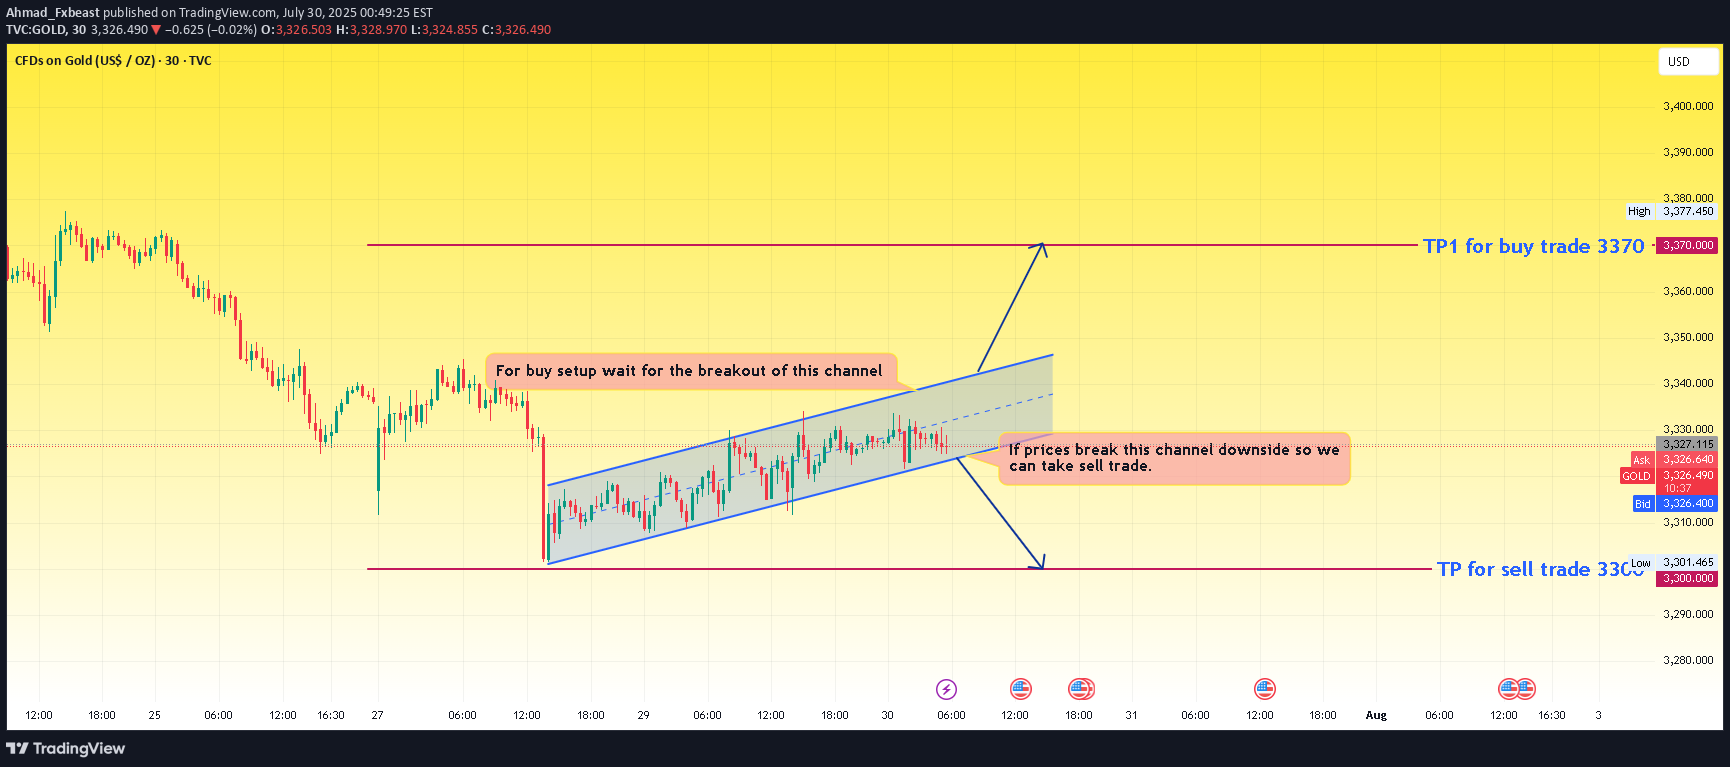
This chart presents a range-bound price action within an ascending channel and offers two potential breakout trade opportunities depending on price direction. 🔍 Chart Summary: > Current Price: Around 3326-3328 > Pattern: Ascending channel > Bias: Neutral (waiting for breakout) 📊 Channel Analysis: > Price is moving inside an ascending channel, marked by two parallel trendlines (support and resistance). > This suggests gradual bullish pressure, but the price is still within a consolidation/ranging structure. > Buyers and sellers are currently indecisive, waiting for a clear breakout direction. 🧠 Trade Scenarios: ✅ Buy Setup: : Condition: Breakout above the upper channel resistance : Confirmation: Break and close above channel, ideally with strong bullish candles and volume : Target: 3370 (marked as TP1 for buy trade) > Reasoning: Breakout confirms buyer dominance and momentum continuation ❌ Sell Setup: : Condition: Breakdown below the lower channel support : Confirmation: Break and close below the channel with a bearish engulfing or volume spike : Target: 3300 (marked as TP for sell trade) > Reasoning: Break below structure indicates loss of buyer control and return of bearish trend ⚠️ Key Notes: : The ascending channel suggests short-term bullish strength, but no strong trend has been confirmed yet. : Avoid entering within the channel—this is a no-trade zone due to market indecision. : Wait for confirmation of breakout/breakdown before entering trades. ✅ Conclusion: > The price is currently in a rising consolidation channel. > Breakout above = buy opportunity toward 3370 > Breakdown below = sell opportunity toward 3300 This is a classic wait-for-breakout setup—ideal for breakout traders looking for defined risk and reward zones.Congrats as we analyzed after breaking the channel our Sell Setup went successfully and we achieved our target one.Target achieved we can still see more bearish move now our 2nd target is 3280

Ahmad_Fxbeast
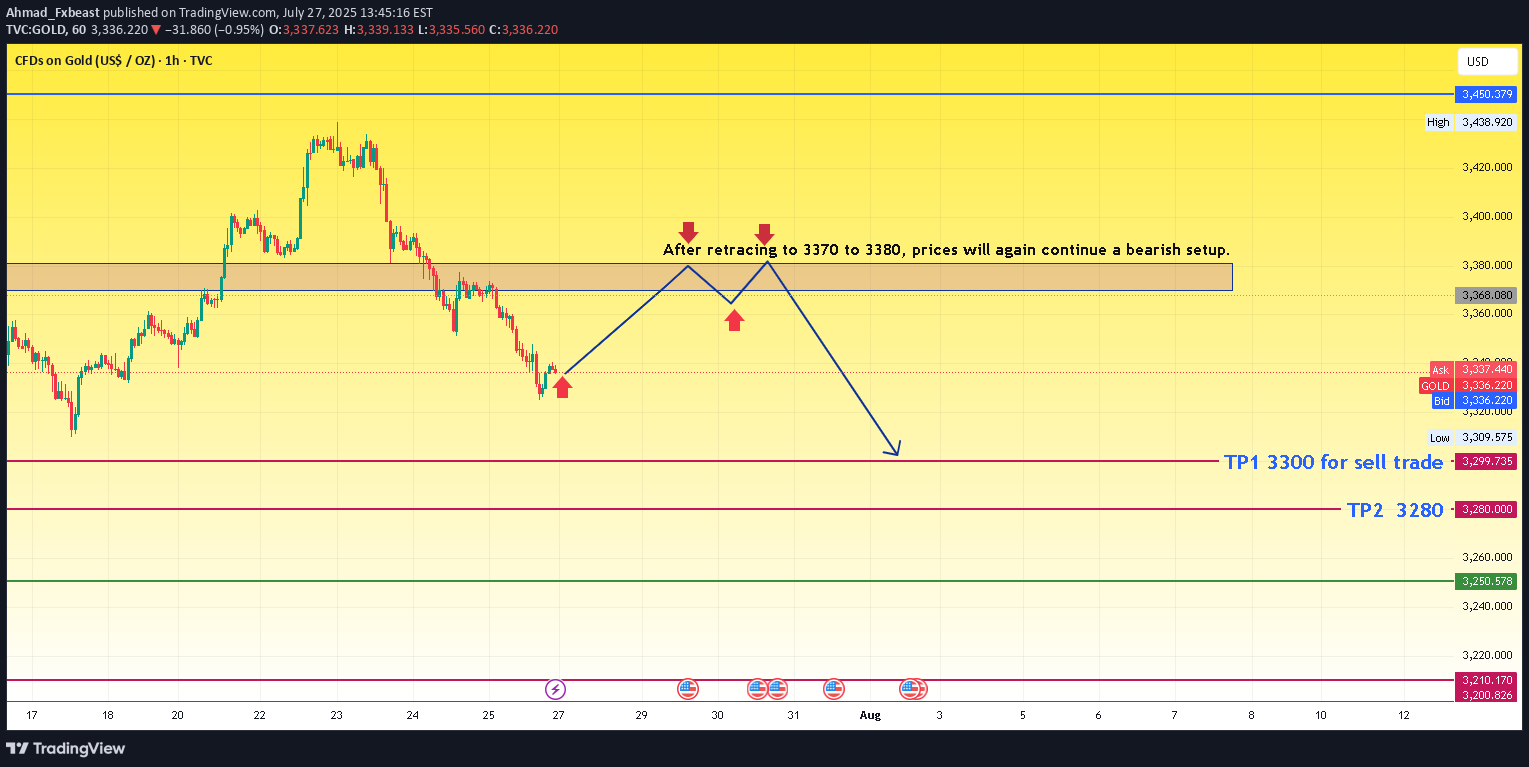
The chart presents a bearish outlook for gold based on a retracement and continuation pattern. Here's a detailed analysis: 🔍 Chart Summary: Current Price: Around 3336 Bias: Bearish (after retracement) Resistance Zone: 3370 – 3380 Sell Confirmation Area: Upon rejection from the 3370–3380 resistance zone Target 1 (TP1): 3300 Target 2 (TP2): 3280 📈 Technical Structure: Recent Trend: The price has dropped sharply from its recent peak. Now it's attempting a pullback to previous support, which has turned into a resistance zone (3370–3380). Price Action Expectation: A retracement is expected toward 3370–3380. If the price gets rejected from this resistance block, the chart suggests the formation of a lower high. After rejection, a bearish continuation is expected. Projected Move: Short entry around the resistance zone. Targets: TP1: 3300 (intermediate support) TP2: 3280 (major support) 🧠 Trade Idea Logic: The chart follows a classic bearish price action setup: impulse → retracement → continuation. The consolidation and break area has flipped from support to resistance. The retracement zone is clearly defined, making it a high-probability area for reversal if bearish signals (e.g., rejection candles) form. ⚠️ Key Considerations: Wait for confirmation: Do not enter blindly at 3370–3380. Look for rejection patterns (like a bearish engulfing or pin bar). Volume and fundamentals: Watch for economic data or geopolitical news that might invalidate the technical setup. SL Suggestion: Above 3385 or 3390 to allow some room for wick spikes.

Ahmad_Fxbeast
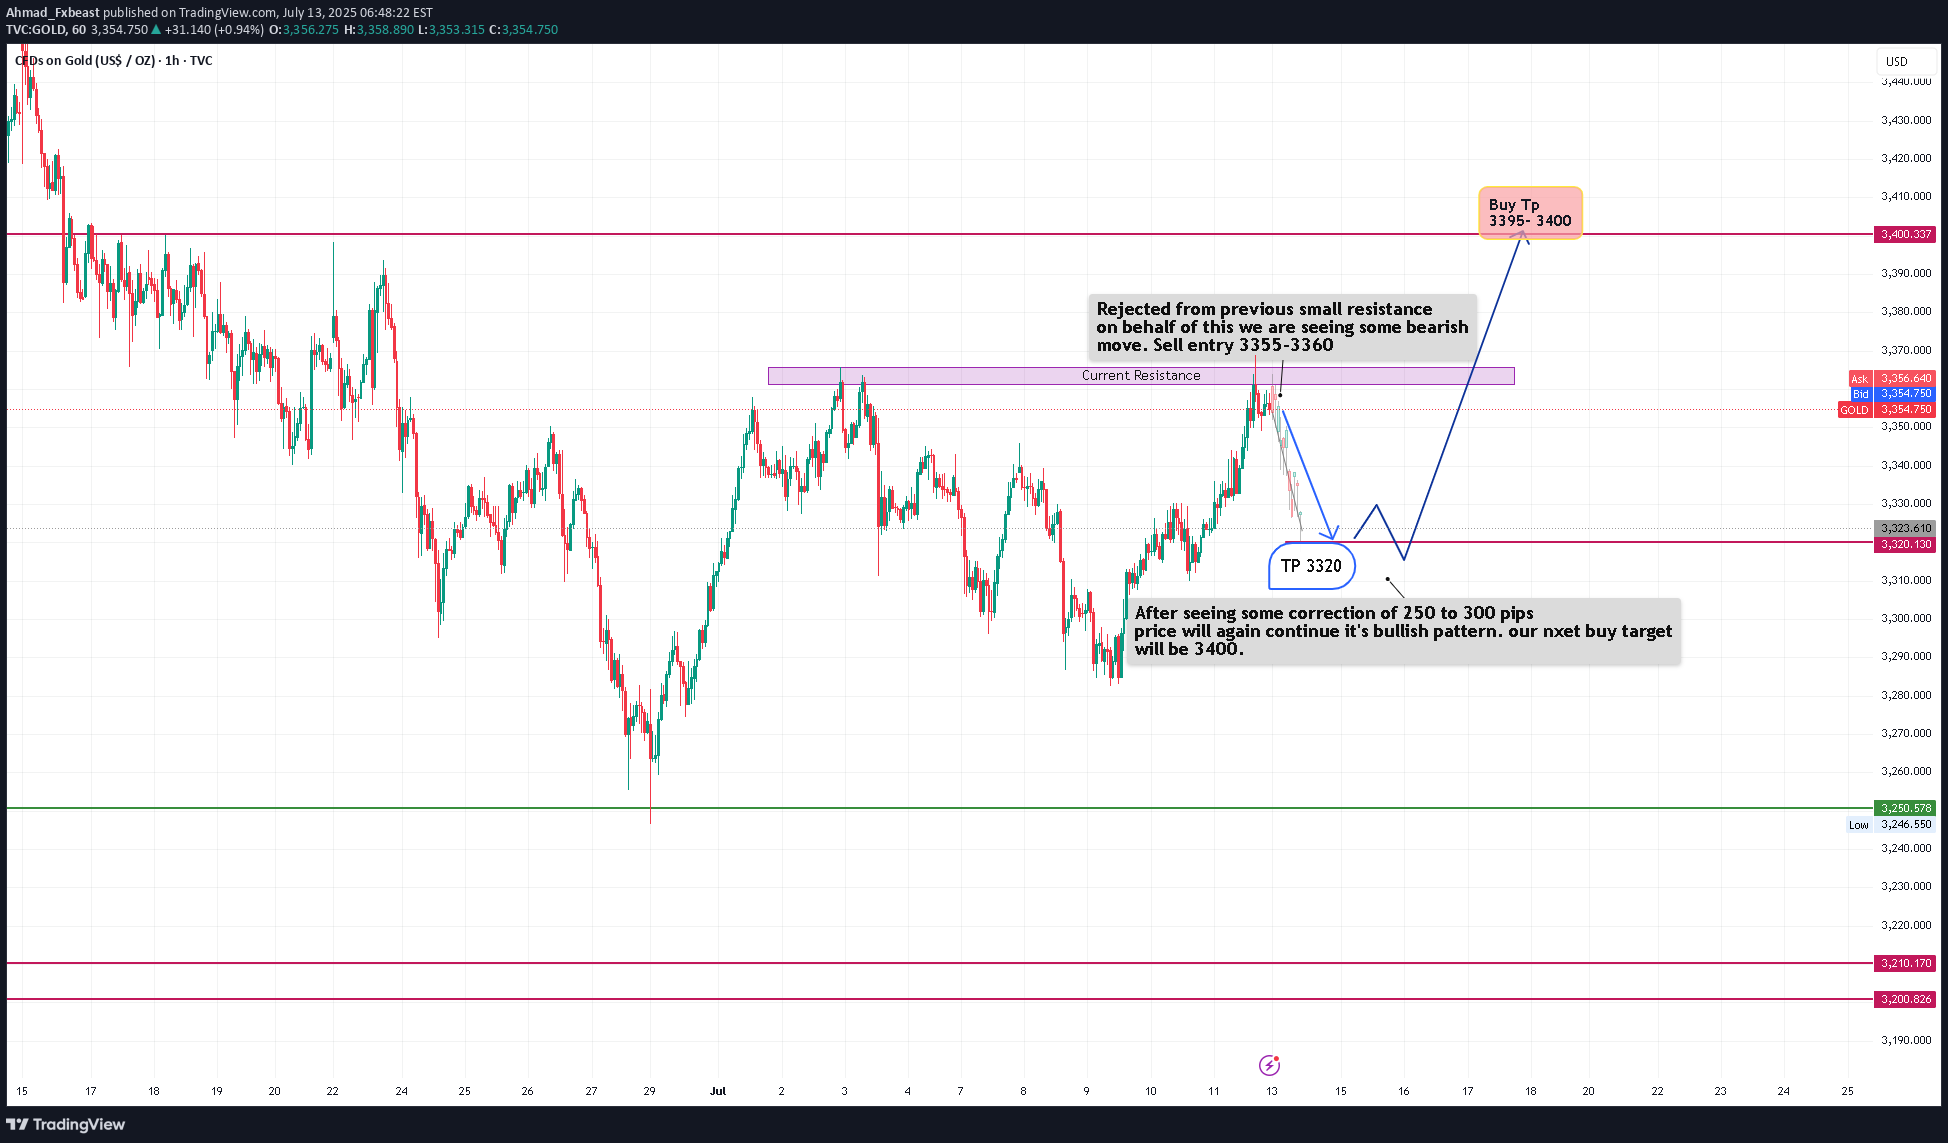
🟣 Current Market Behavior Price has reached a resistance zone around 3355–3360, previously respected as a supply area. A rejection candle or price weakness at this level is triggering a short-term bearish outlook. 🔻 Short-Term Bearish Plan Sell entry zone: 3355–3360 > Target for this sell (TP): 3320 ➤ This suggests a possible drop of around 250–300 pips from the current high. > Reason: The price is expected to make a technical correction after hitting a resistance level. 🔼 Mid-Term Bullish Plan : After reaching the 3320 support area, the chart expects a bullish reversal or continuation of the uptrend. > Buy setup target: 3395–3400 ➤ This level represents the next potential bullish wave after the correction. > Reason: The overall pattern remains bullish. The idea assumes this drop is temporary and part of a healthy pullback before the uptrend resumes. 📝 Summary: Phase 1: Sell from 3355–3360 to 3320 (correction phase) Phase 2: Buy from 3320 toward 3395–3400 (bullish continuation) Strategy combines resistance rejection + correction + trend continuation principles.Heading towards our sell tp which is 3320. After that if you find good confirmation so you can enter for buy trade.

Ahmad_Fxbeast
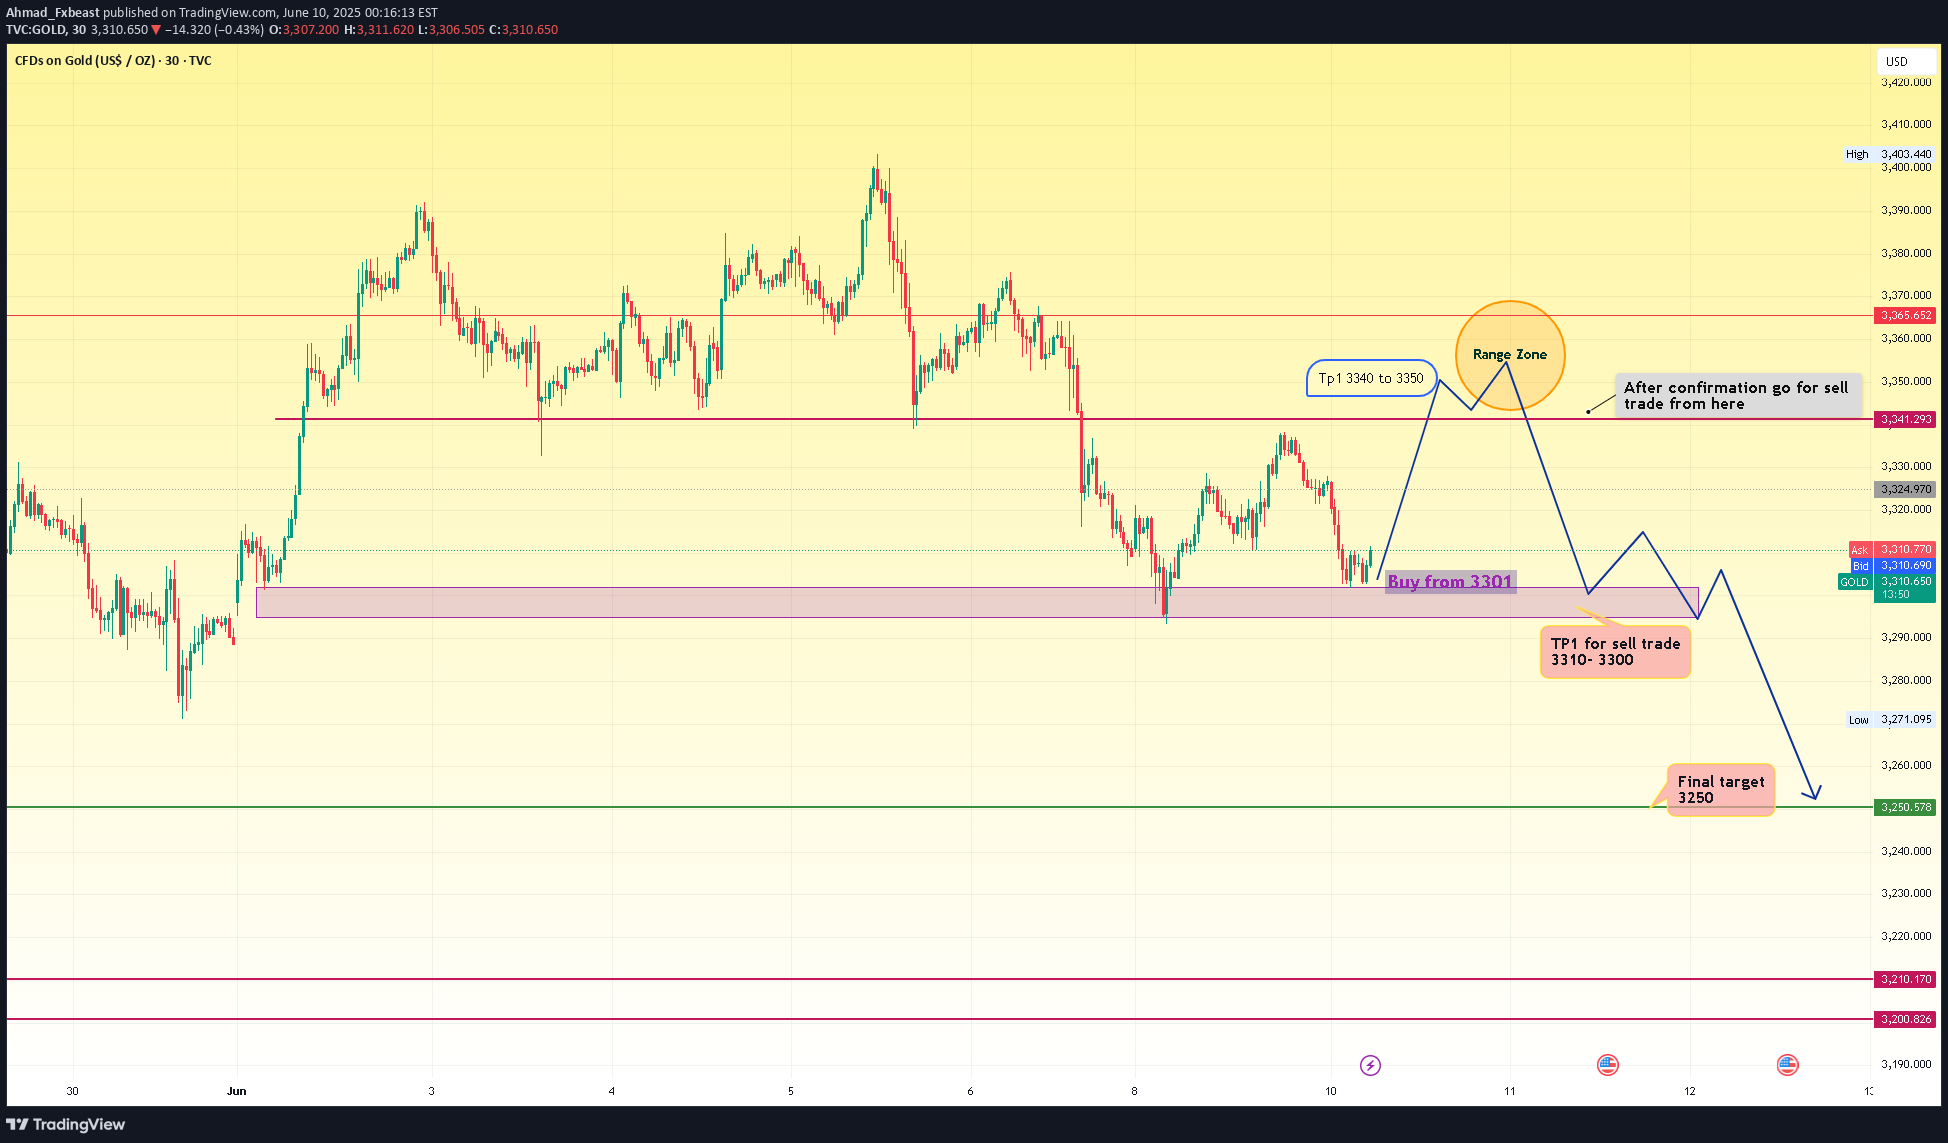
This chart outlines a two-phase trading strategy:▶ Buy from the demand zone, followed by▶ Sell from the resistance/range zone.🟦 Phase 1: Buy SetupBuy Entry: Around 3301 (marked demand/support zone): TP1 (Take Profit): 3340–3350 zone (previous supply/resistance area): The price is expected to bounce from this demand zone and rally toward the Range Zone.🟧 Phase 2: Sell Setup (After Confirmation)Sell Zone: After price hits 3340–3350 and confirms rejection in the Range Zone> TP1 for Sell: 3310–3300 zone> Final Target: 3250 (major support level)> This move expects a bearish reversal after failing to break the range top.🟡 Key Notes:Range Zone = 3340–3350 is a key decision point. Wait for a reversal signal (e.g., double top, bearish engulfing) before shorting.The setup blends support/resistance, price action, and zone trading logic.✅ Summary:Buy from 3301 → TP at 3340–3350Sell from 3340–3350 (after confirmation) → TP1: 3300, TP2: 3250

Ahmad_Fxbeast
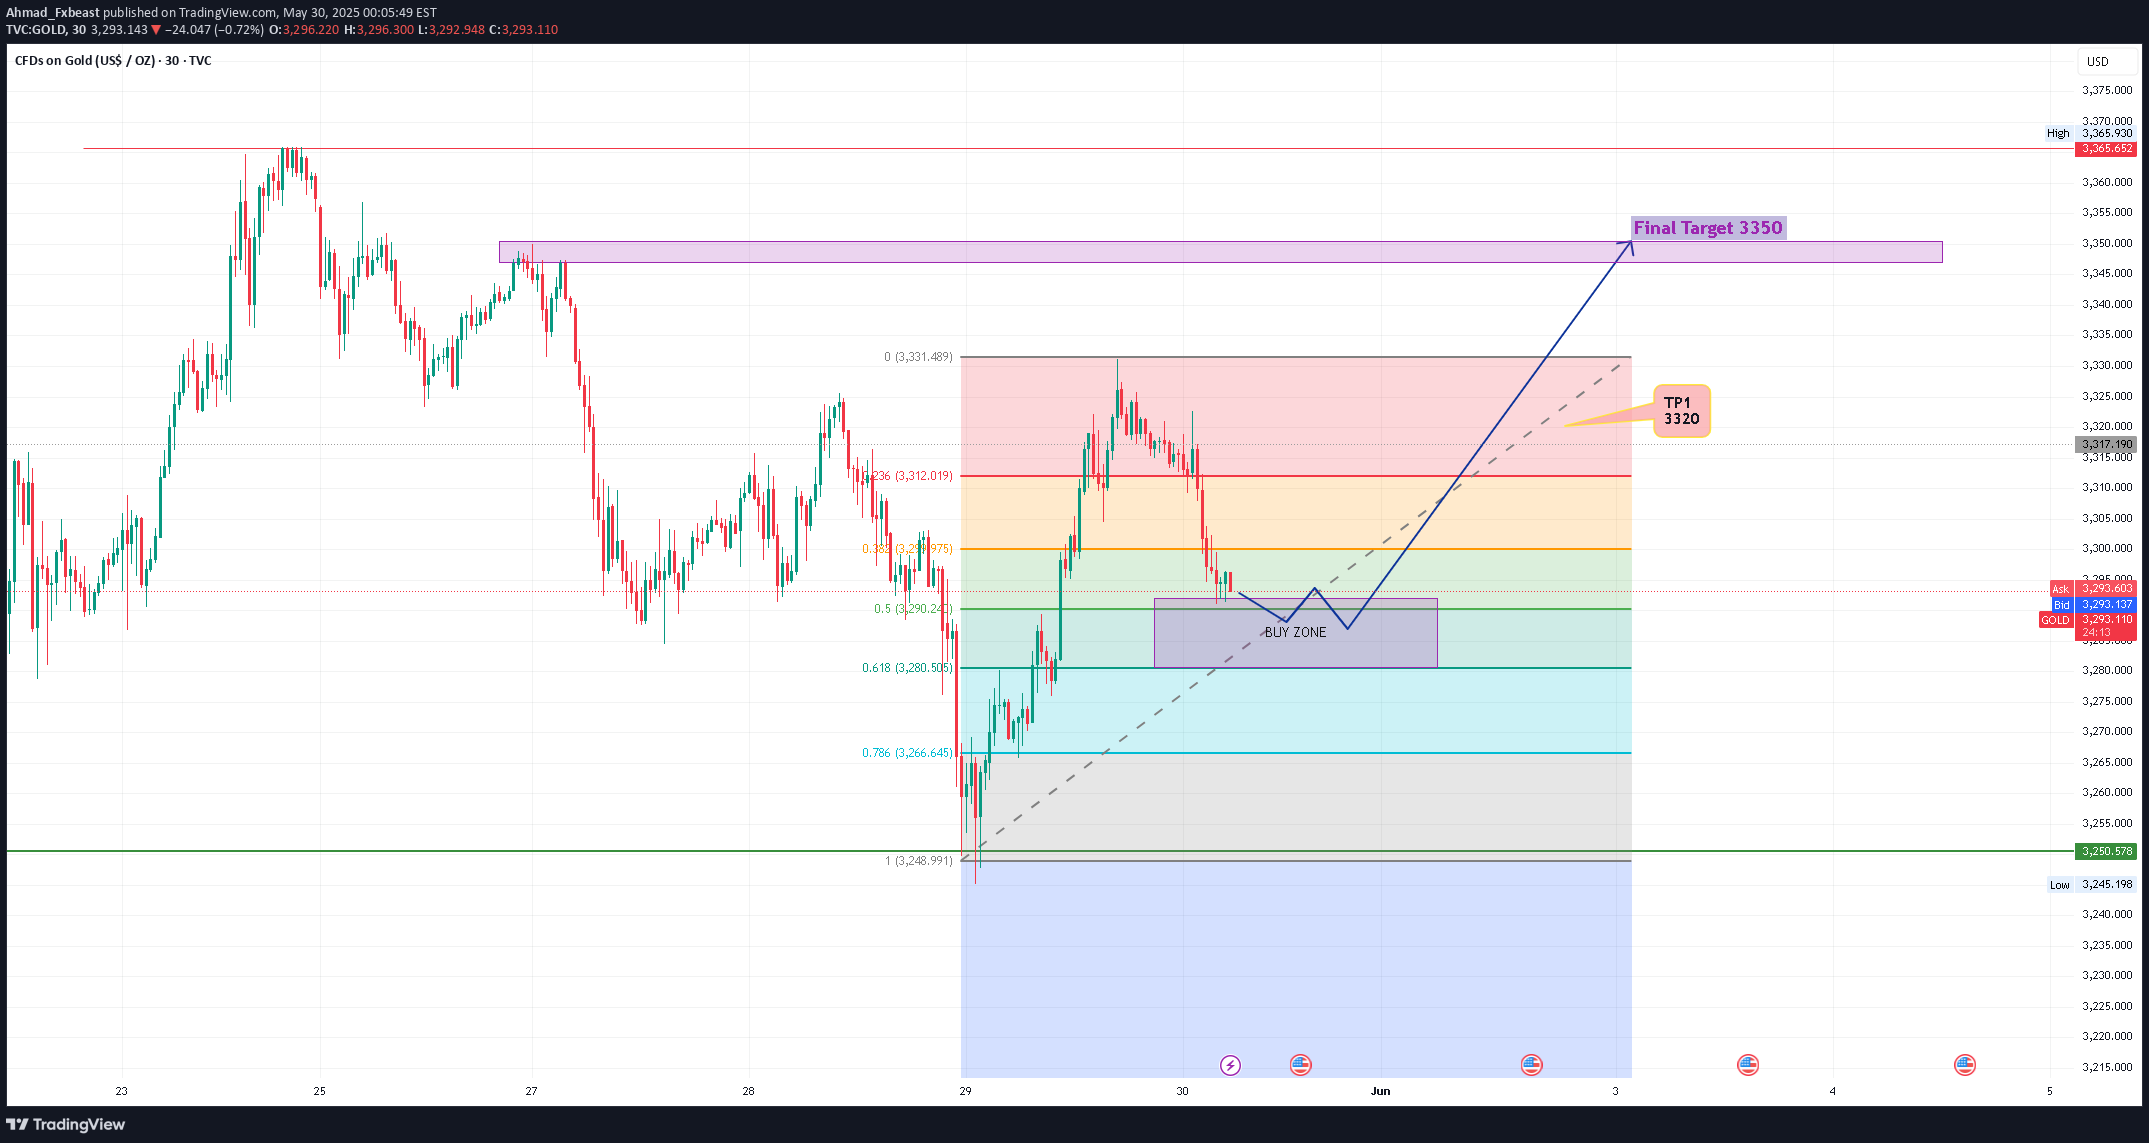
This chart presents a bullish trading setup on gold (XAU/USD) based on a Fibonacci retracement strategy. It suggests a buy opportunity after a pullback.✅ Fibonacci Levels:> 0.0% (Top): $3,331 – recent swing high (used as reference)> 23.6%: $3,312 – minor resistance zone> 38.2%: $3,297 – initial pullback area> 50.0%: $3,290 – psychological mid-level> 61.8% (Golden Ratio): $3,280 – key Fibonacci support> 78.6%: $3,266 – deeper retracement support> 100% (Bottom): $3,249 – recent swing low🟪 Buy Zone (Between 50% and 61.8%):The marked BUY ZONE is between $3,290 and $3,280, aligning with the Fibonacci golden pocket.This is a high-probability reversal area, as it combines:Strong Fibonacci confluence (50%–61.8%)Prior price reaction zones (structure-based support): TP1: $3,320 – aligns with previous structure zone and 23.6% retracement.: Final Target: $3,350 – a retest of the major resistance and previous high.📌 Conclusion:This is a classic Fibonacci retracement long setup:Wait for a bullish reversal pattern (e.g., pin bar, engulfing) in the buy zone.As long as the price holds above $3,266, the bullish structure remains valid.Ideal for swing traders looking to catch a bounce off the golden ratio support.We almost achieved our TP1 3320, our setup is still valid, and we are heading towards our final target 3350.

Ahmad_Fxbeast
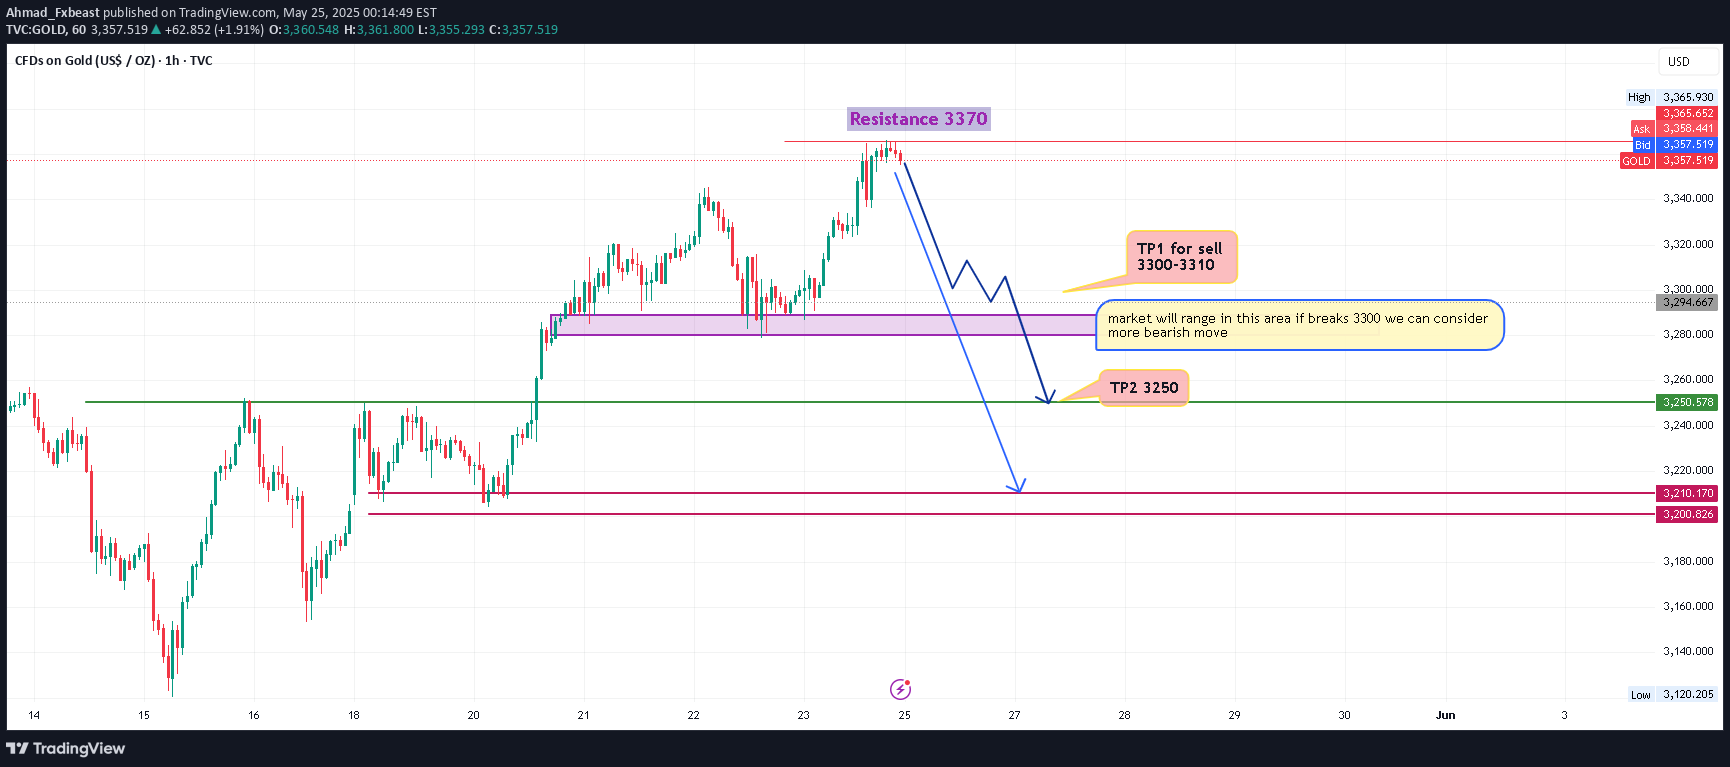
This chart outlines a bearish trading setup for gold (XAU/USD) after a strong rally toward resistance. Here's a breakdown of the setup and what to watch:📉 Bearish Setup Explained: Price recently tested the resistance at $3,370 and showed signs of rejection.: A correction move is projected with targets set at:: TP1: $3,300–$3,310 (first support/test zone): TP2: $3,250 (deeper support zone)⚠️Breakout Condition:The note says:> The market will range in this area; if it breaks $3,300, we can consider more bearish move.> This implies that $3,300 is a critical level — a close below this confirms further downside momentum.🔍 Key Zones: Resistance Zone: $3,370: Sell TP1 Zone: $3,300–$3,310: Key Breakdown Area: $3,300: Sell TP2: $3,250: Major Support Below: Around $3,200–$3,210🔄 Range Possibility> If the price doesn't break $3,300 decisively, expect sideways movement between $3,310–$3,330.> Only a clear break and retest below $3,300 should trigger continuation toward $3,250 and potentially to $3,210–$3,200 support.As we discussed, the 3360-3370 area worked as a resistance. After opening the market, we saw some bearish moves and a sell setup that gave us almost 300+ pips. So now our sell trade is still active; wait for the levels and confirmation. Thank you

Ahmad_Fxbeast
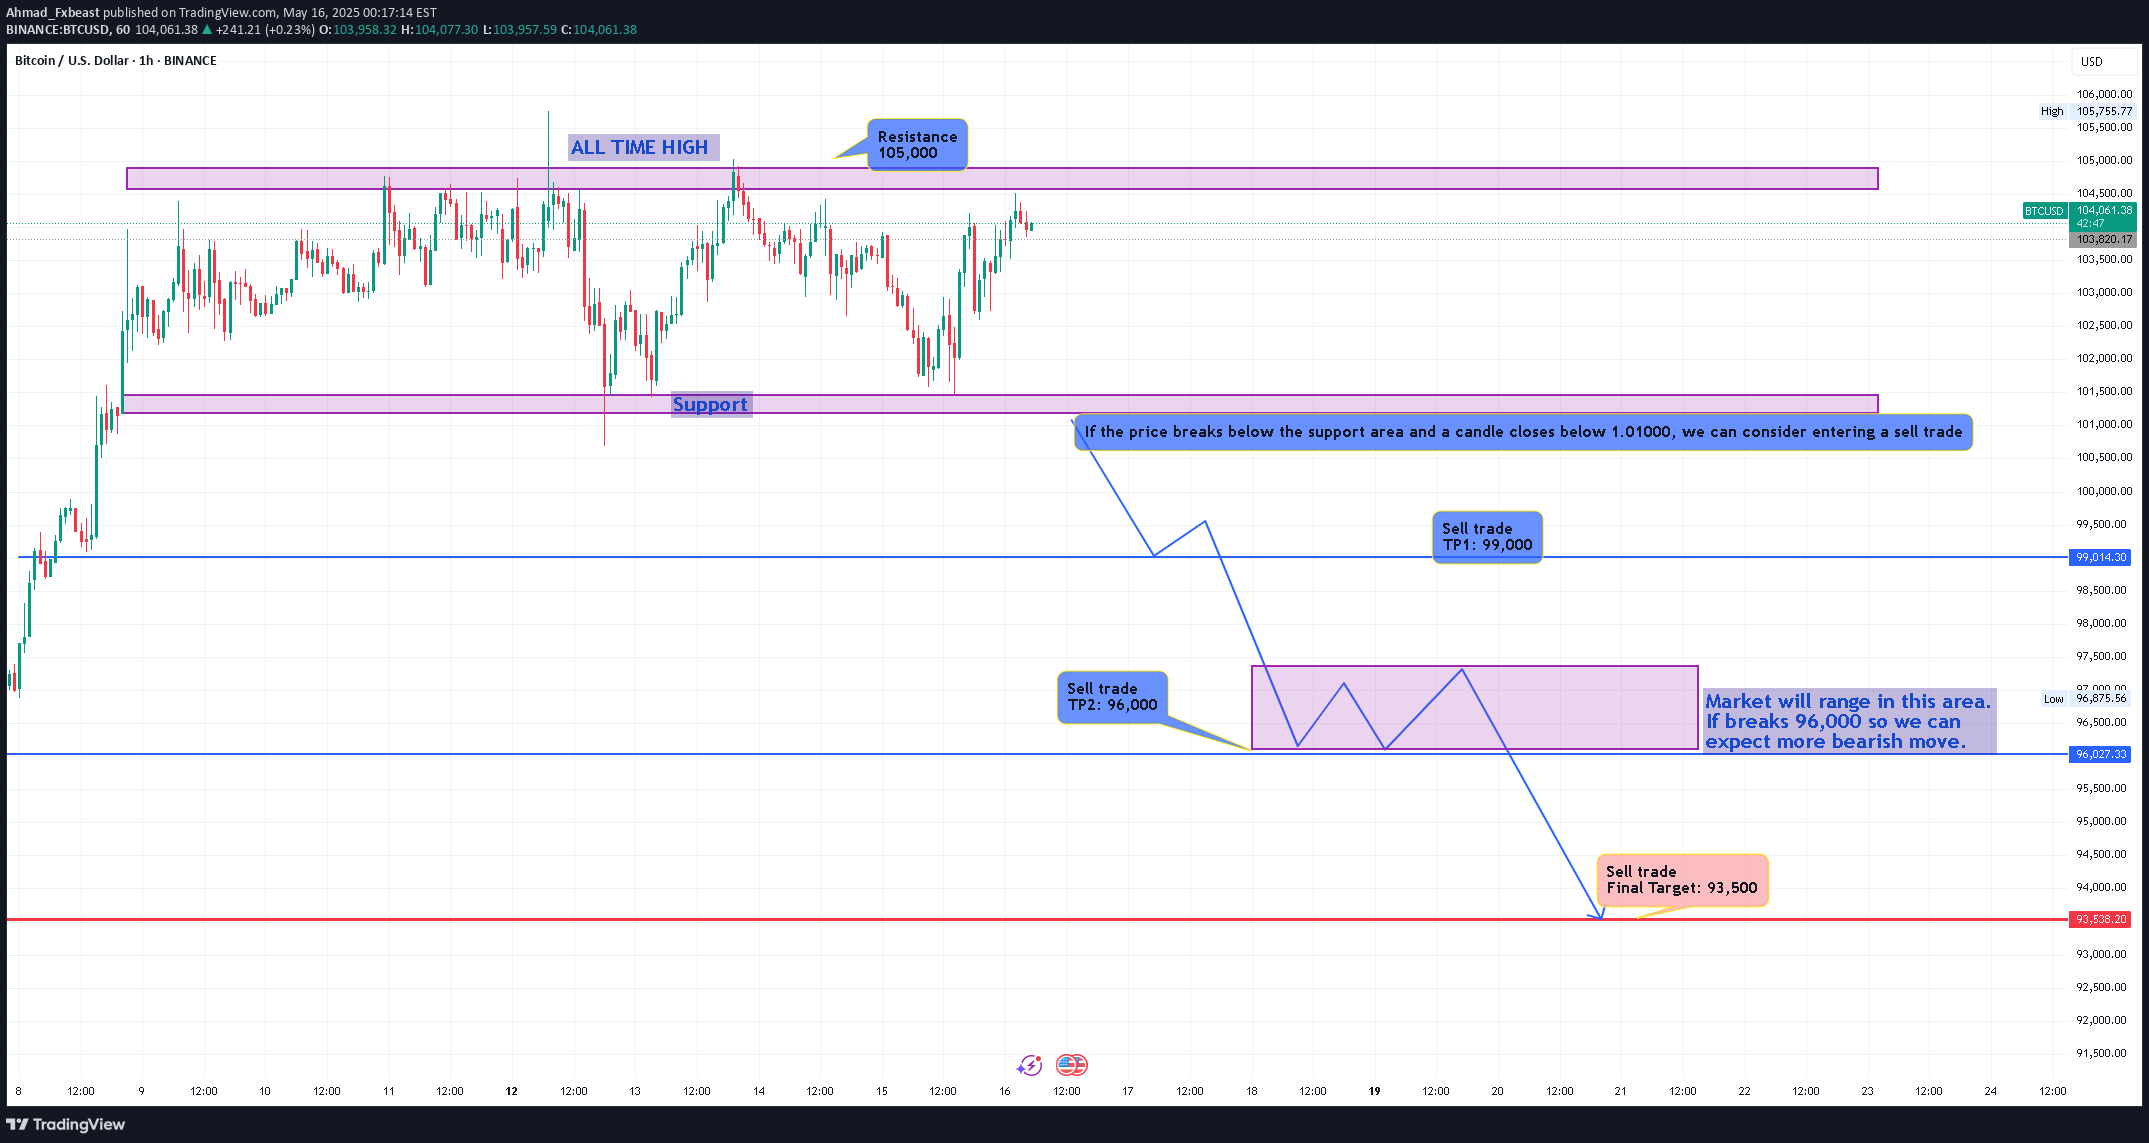
Note: This chart presents a short-biased plan for BTC/USD based on key technical levels and price action signals.🔍 Key Levels: Resistance / All-Time High Area: $105,000: Support Zone: Around $101,000: Sell Trade TP1: $99,000: Sell Trade TP2: $96,000: Final Target: $93,500: Critical Breakdown Level: $101,000 (Support)📌 Plan Breakdown🟦 Bearish Bias Setup:> The market is consolidating between $101,000 support and $105,000 resistance, forming a range-bound structure near all-time highs.> A breakdown below $101,000 support with a confirmed candle close below that level would trigger a sell signal.> Rewritten chart note:If the price breaks below the $101,000 support area and a candle closes beneath it, we can consider initiating a sell trade.🔽 Downside Path:: If the price breaks the support:: First target: $99,000 — minor support.: Second target: $96,000 — highlighted range zone.: If the price breaks below $96,000, expect further downside toward $93,500 (final target).🔄 Sideways Possibility:: If the price breaks below $101,000 but fails to push through $96,000, the market may range between $96K–$99K before choosing a direction.: The purple box (around $96K) is expected to be choppy — a break below confirms strong bearish continuation.

Ahmad_Fxbeast
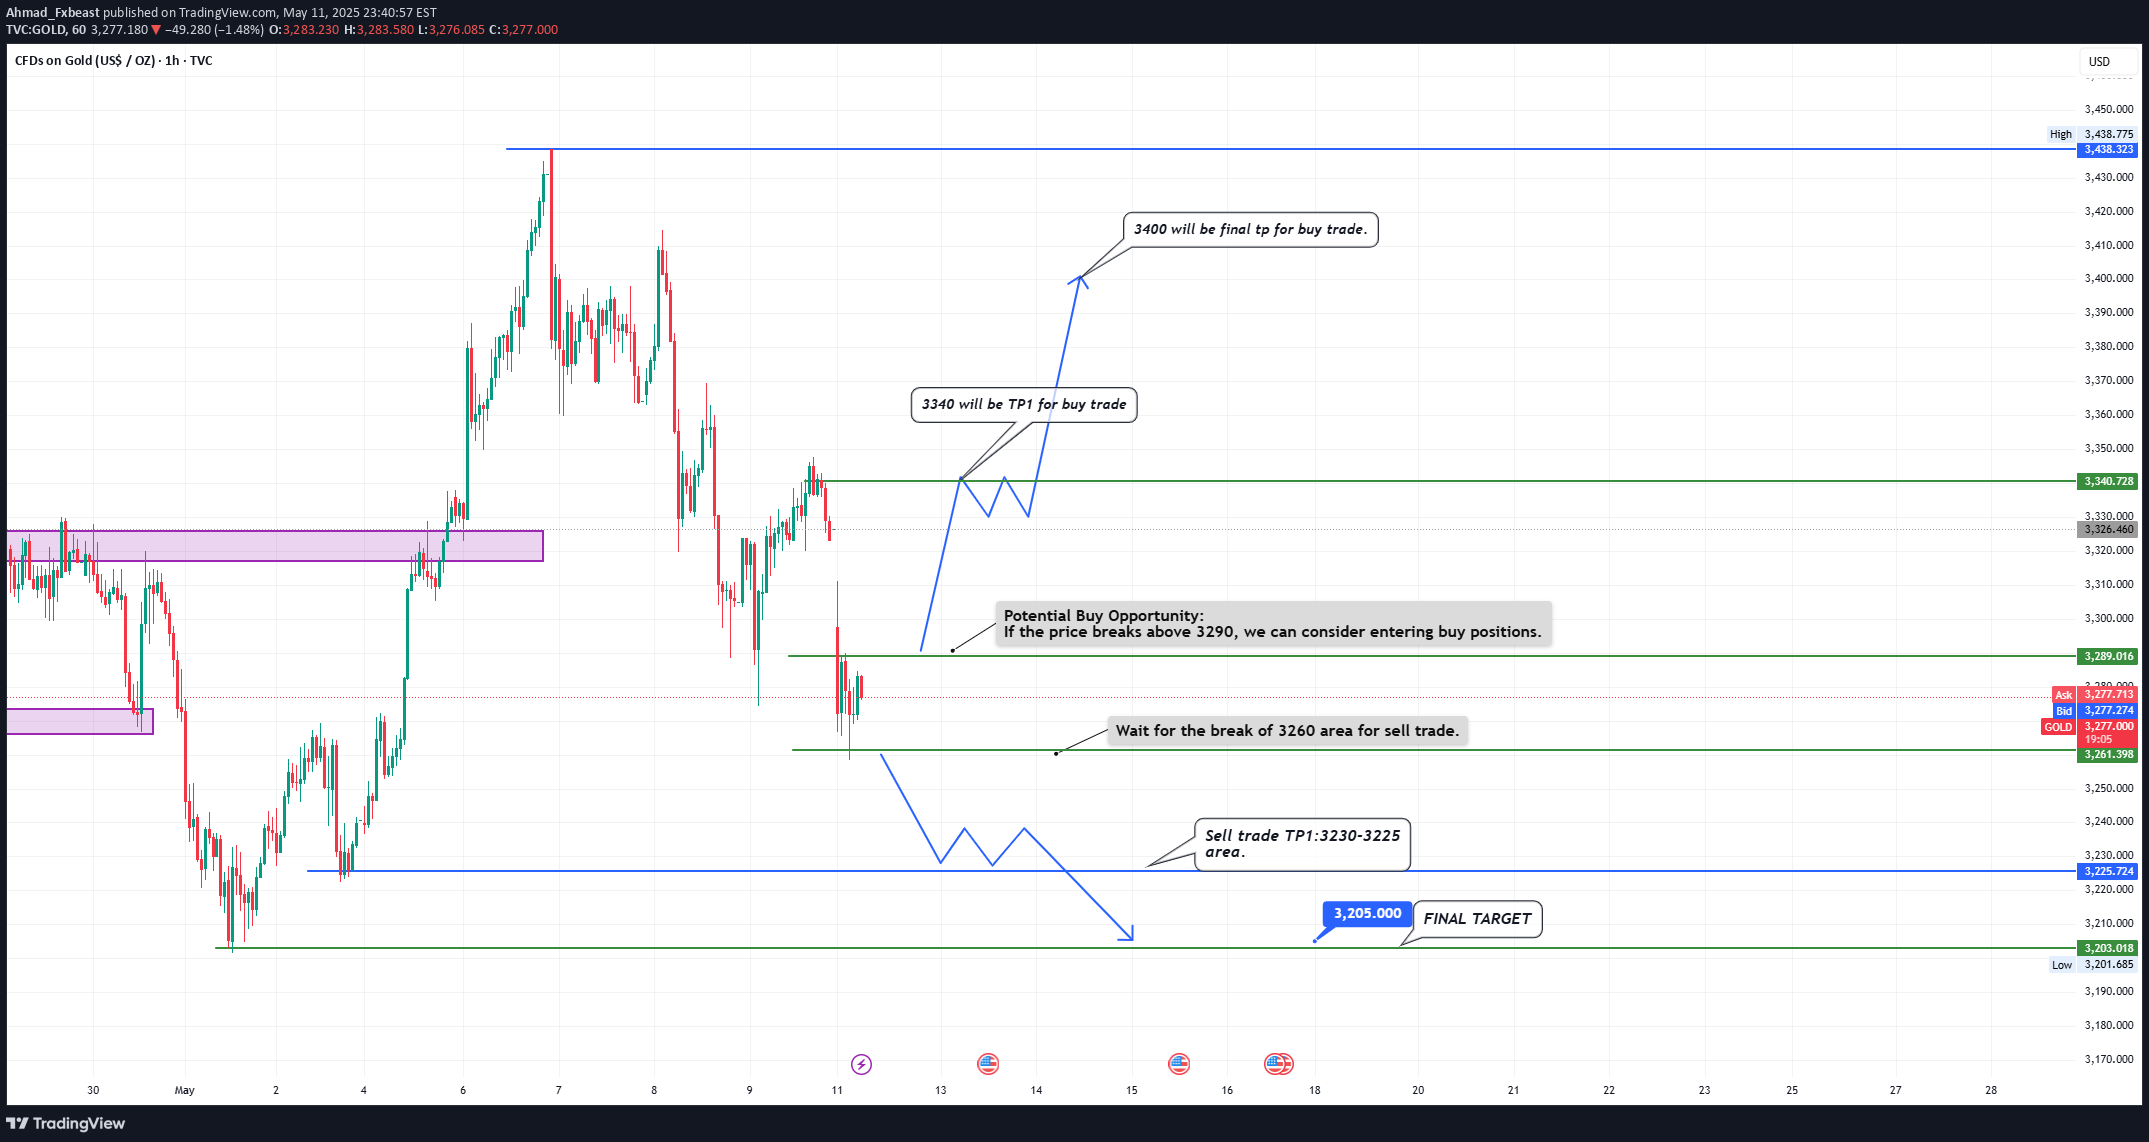
📌 Chart OverviewTimeframe: 1 HourCurrent Price: ~ 3275-3280Bias: Conditional (based on breakout confirmation).As previously analyzed, Gold has reached 3270 area. This zone will determine the next market direction- bullish or bearish. Check out our trade plan for potential opportunities!✅ Buy Trade Setup (Bullish Scenario):Trigger: Price breaks and closes above 3290 Plan:: Enter long after confirmation (e.g. bullish candle close above 3290): TP1: 3340: Final TP: 3400 Reasoning:> Breakout above a key intraday resistance> Pattern suggests potential bullish momentum continuation.❌ Sell Trade Setup (Bearish Scenario)Trigger: Break and close below 3260Plan::Enter short after confirmation of breakdown: TP1: 3230–3225 zone: Final TP: 3205Reasoning:>If price fails to hold above 3260, likely to revisit previous demand zones>Clean drop potential visible on the left side of the chart Key Decision Area:>3260–3290 zone is crucial:>Acts as a no-trade zone unless broken>Avoid getting trapped in consolidation or fakeouts hereCongrats traders. As we analyzed after breaking of 3260 market comes down and our sell Target1 3225 successfully achieved ✅ we booked 350 pips ⚡️Congrats we successfully achieved our Final Target.

Ahmad_Fxbeast
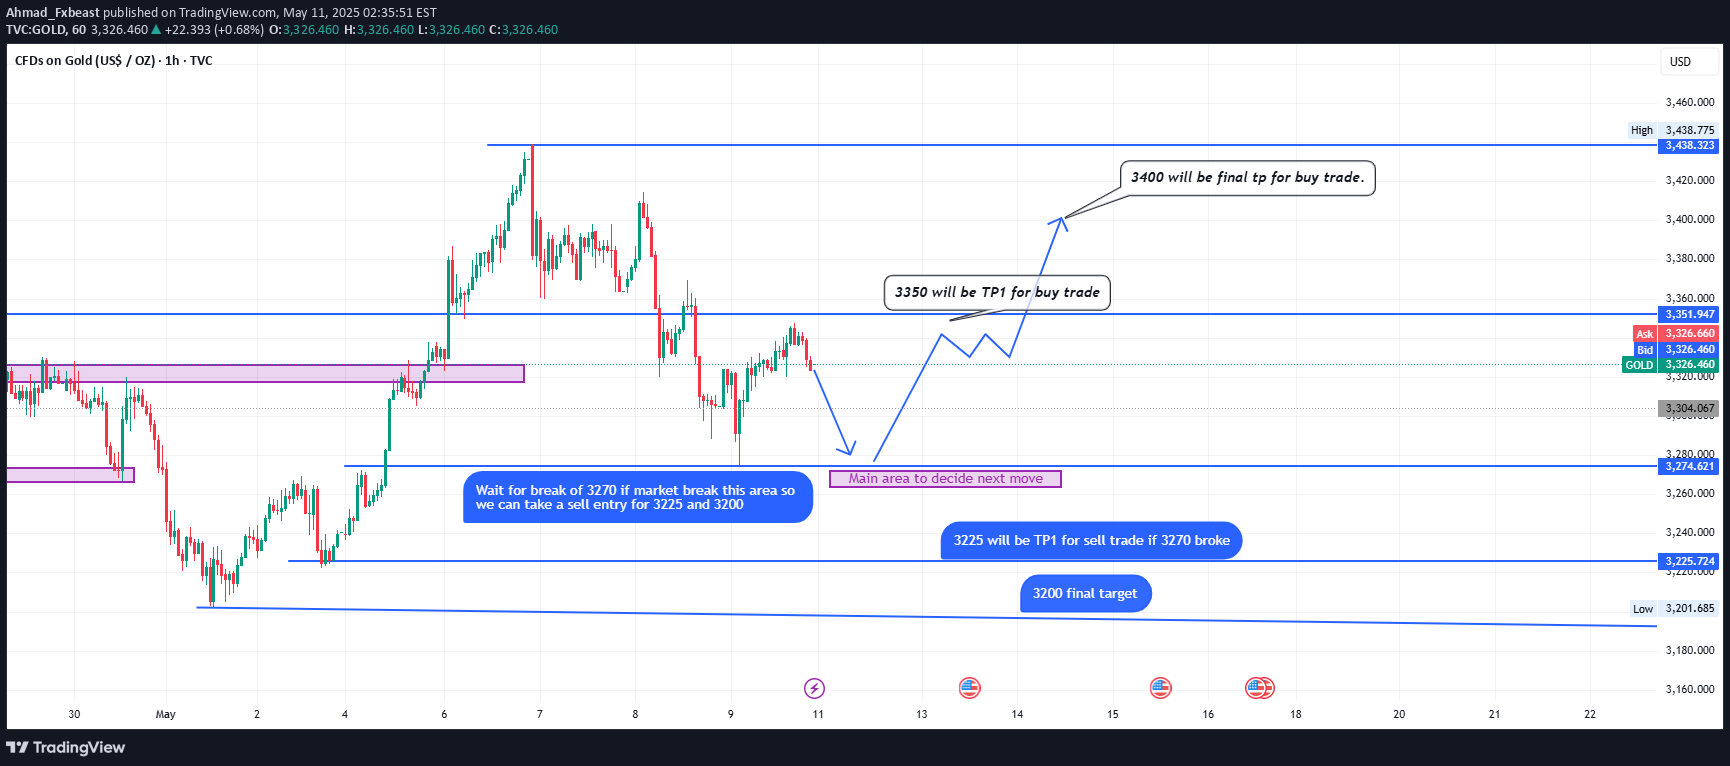
Chart Analysis Overview: 🔹 Key Level: 3280-3270> This level acts as the decision point for the next move.> The price is currently hovering just above it, making it crucial for short-term direction.📉 Bearish Scenario (Sell Setup)Trigger: Break below 3270: Entry Zone: Around or shortly after the break Targets: >> TP1: 3225 << >> Final TP: 3200 <> TP1: 3350>> Final TP: 3400Rationale: If support holds at 3270, a reversal pattern is expected, targeting the previous resistance areas.✅ Notes:Look for bullish candlestick patterns (e.g., engulfing, hammer) near 3270.Avoid chasing if the price shoots up without a clean pullback.Congrats market perfectly touched the price of 3270 area which was our first plan.Almost 520 pips done.Our final target 3200 hit.

Ahmad_Fxbeast
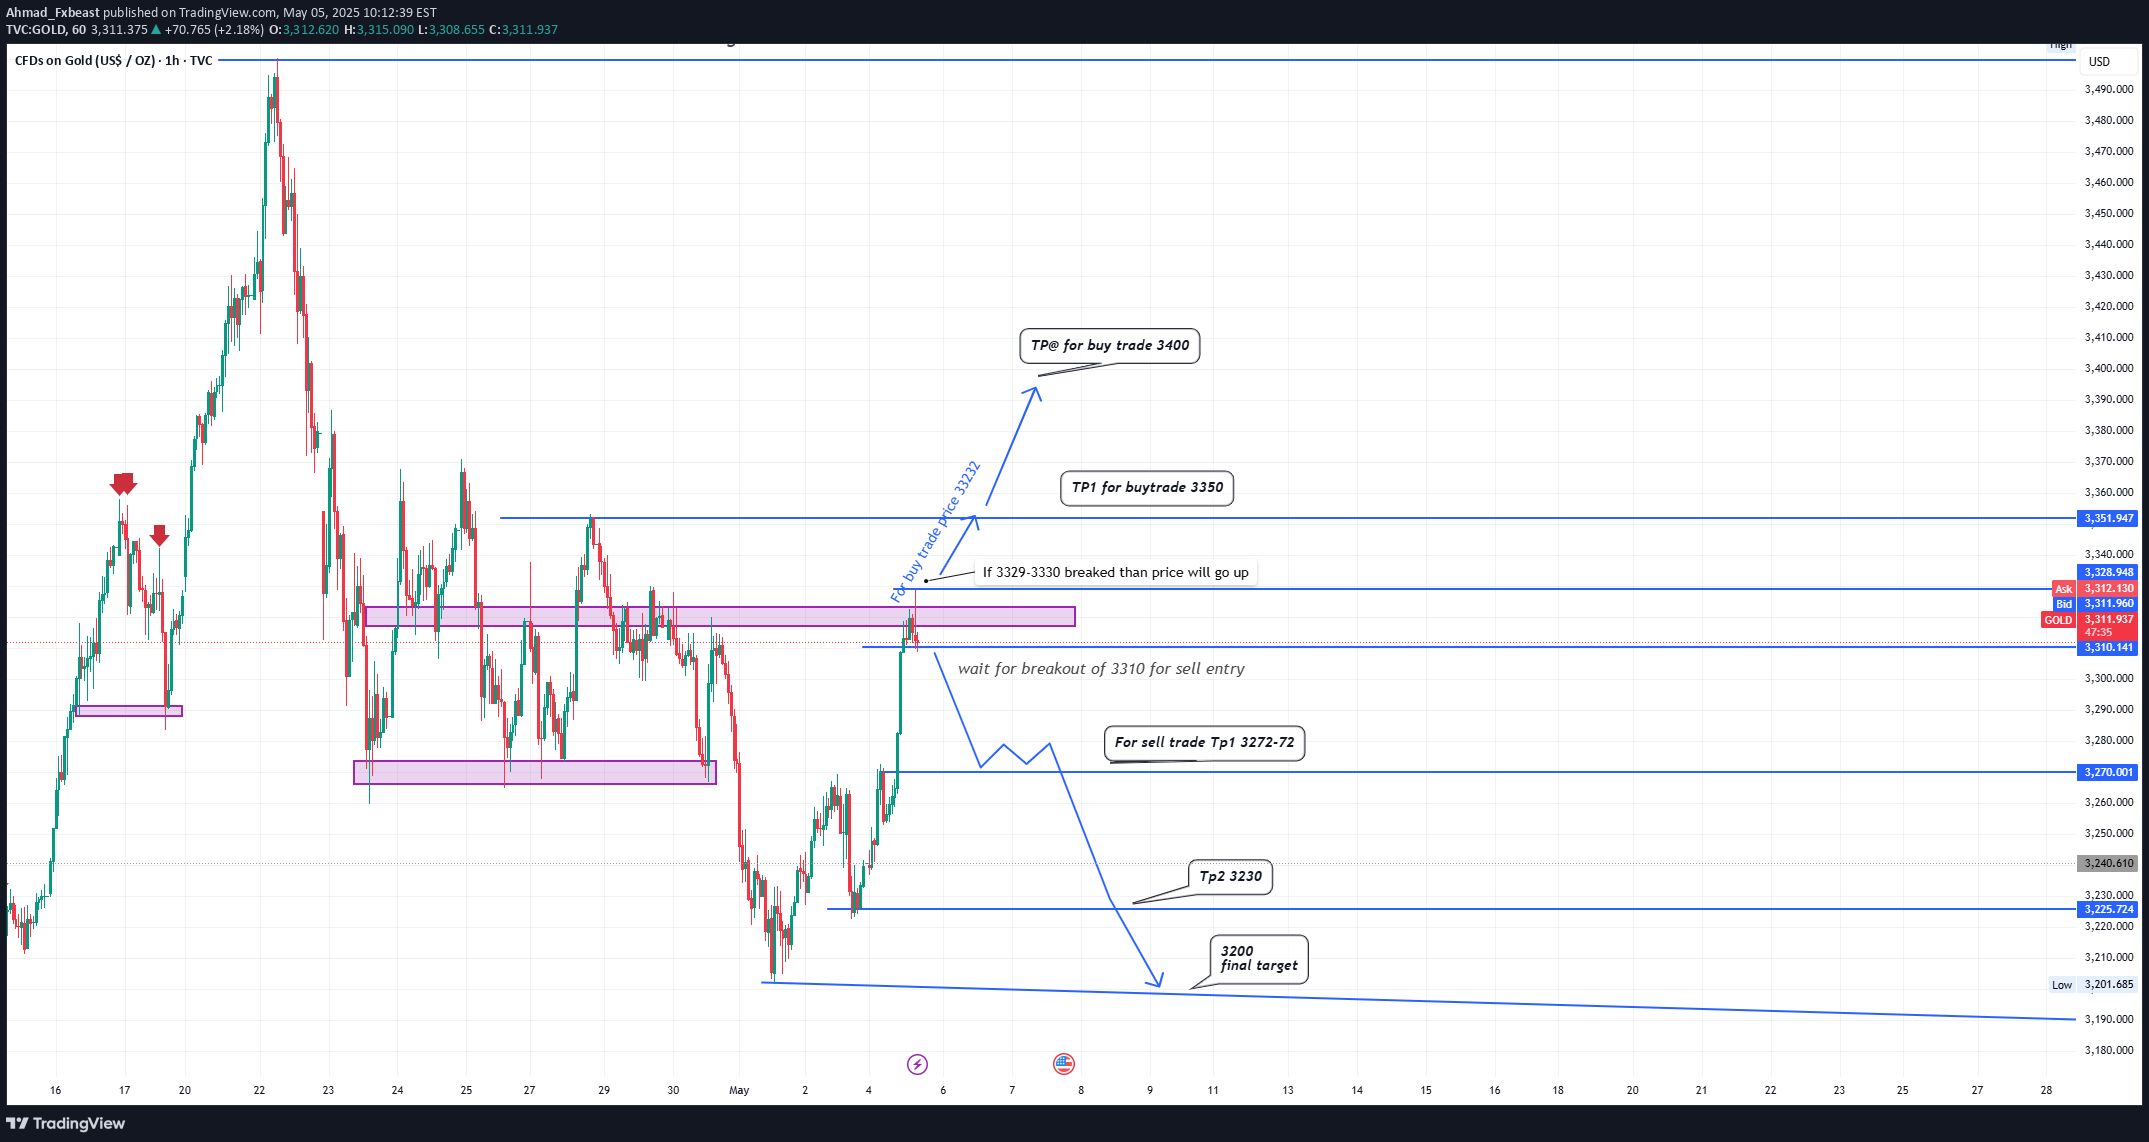
> The chart shows a consolidation area near 3310–3330, which is a key resistance zone.> Price recently made a sharp bullish move into that resistance, now testing the zone.> Several historical rejections (red arrows) align with this level, reinforcing it as a decision point.:Bullish Scenario (Buy Plan):Entry Trigger:If 3329–3330 is broken with confirmation (i.e., retest or strong close above). Targets:TP1: 3350TP2: 3400 Note:Confirmation might be a retest of 3322, labeled as "buy trap price", which could serve as new support. Bearish Scenario (Sell Plan):✅ Entry Trigger:Wait for a clean break below 3310, which has held as a support.🎯 Targets:TP1: 3272–3270TP2: 3230Final Target: 3200🔹 Bearish Flow:The projected price path is a stair-step decline, suggesting pullbacks before continuation downward. Summary & Trade Logic:BiasConditionEntry LevelTake ProfitsBullishBreak & hold above 3330Above 3330 (ideally 3329–3330)3350, 3400BearishBreak below 3310Below 33103272–70, 3230, 3200Congrats who followed our setup after breaking 3330 area market hit our first tp which was 3350 and now approached to our final Target area 3400✅ this setup gives us almost 700 pips.Stay tuned for more analysis
Disclaimer
Any content and materials included in Sahmeto's website and official communication channels are a compilation of personal opinions and analyses and are not binding. They do not constitute any recommendation for buying, selling, entering or exiting the stock market and cryptocurrency market. Also, all news and analyses included in the website and channels are merely republished information from official and unofficial domestic and foreign sources, and it is obvious that users of the said content are responsible for following up and ensuring the authenticity and accuracy of the materials. Therefore, while disclaiming responsibility, it is declared that the responsibility for any decision-making, action, and potential profit and loss in the capital market and cryptocurrency market lies with the trader.