Technical analysis by Ahmad_Fxbeast about Symbol BTC: Sell recommendation (5/16/2025)

Ahmad_Fxbeast
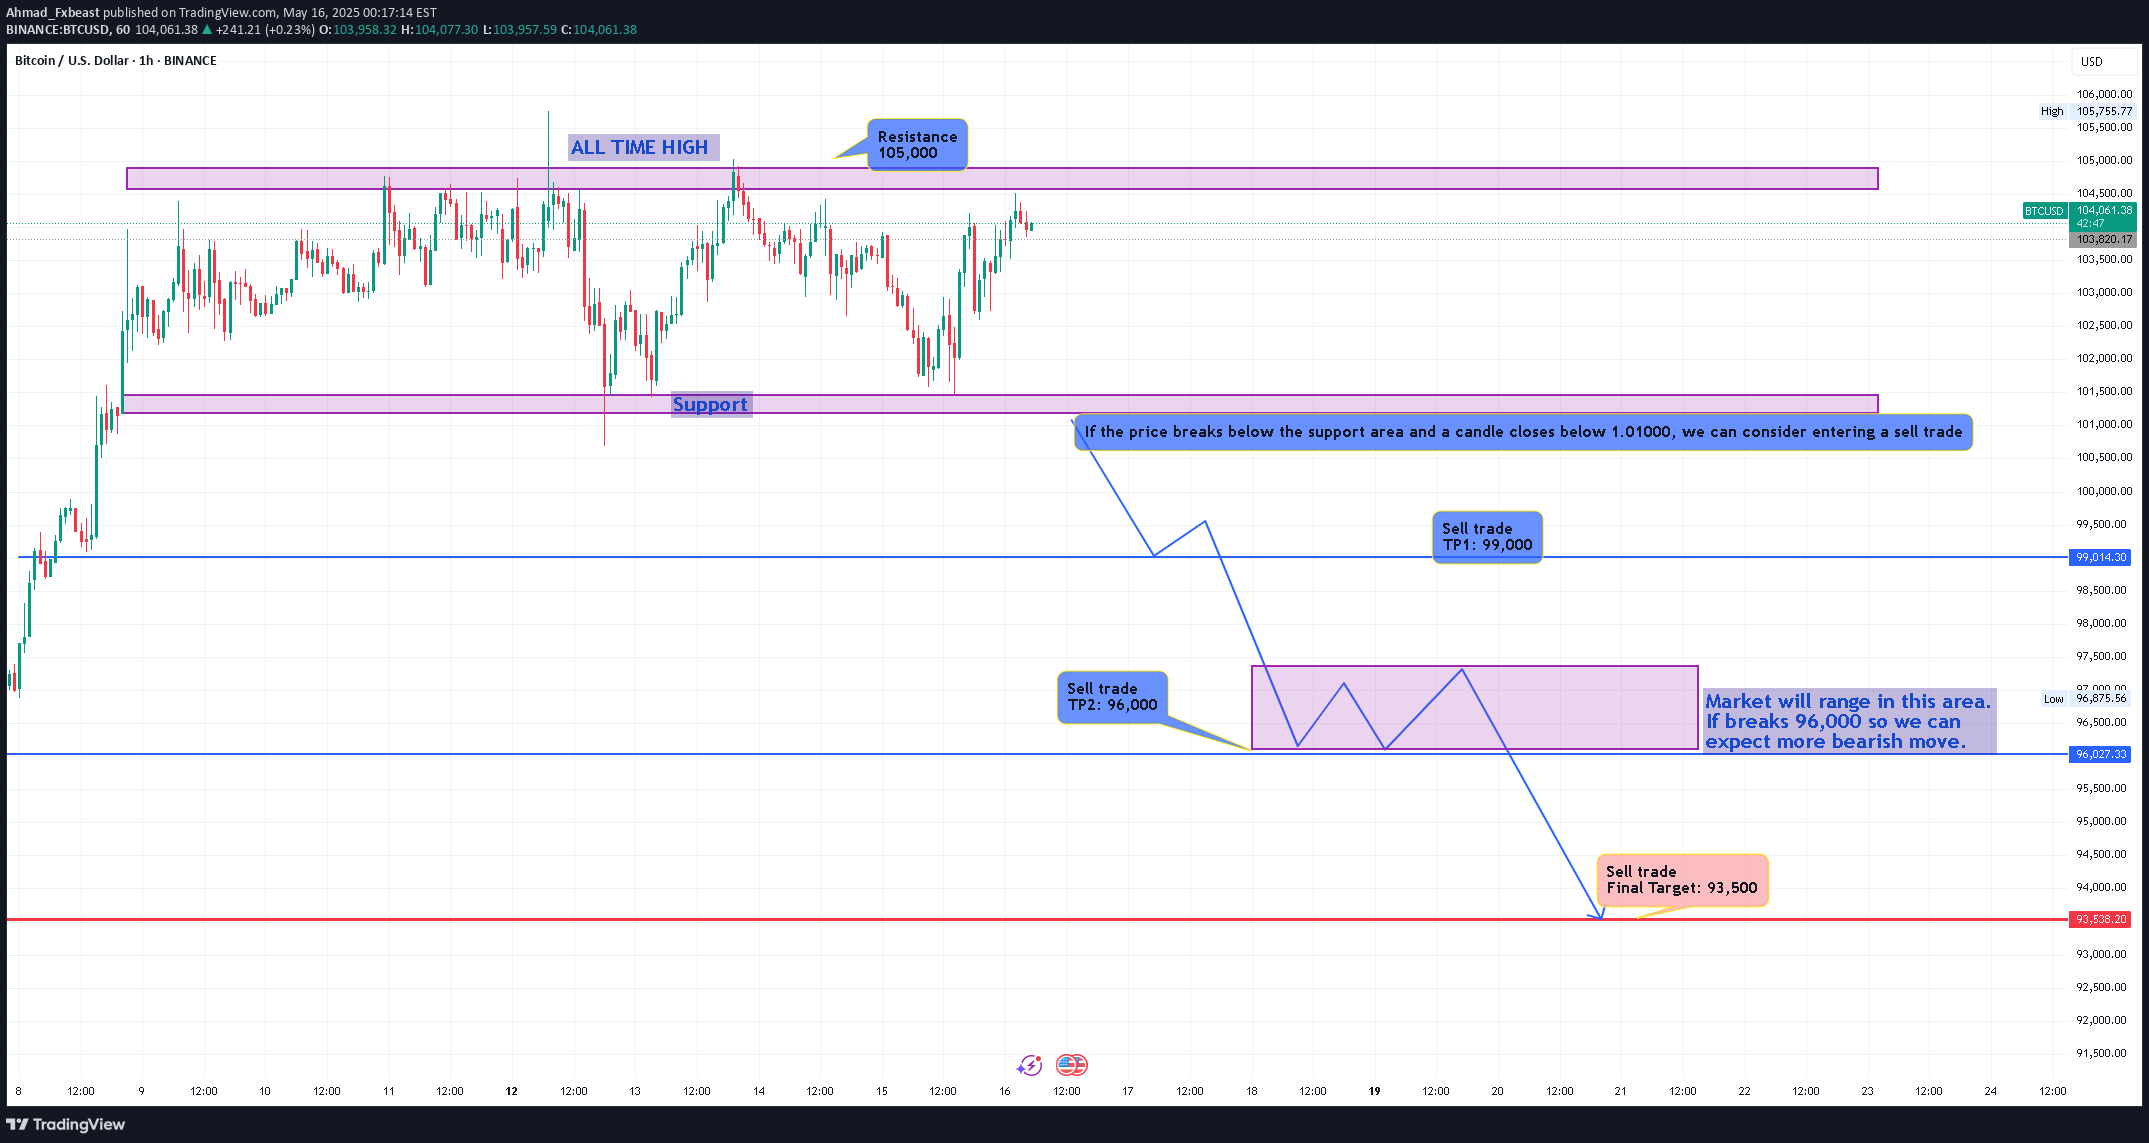
Note: This chart presents a short-biased plan for BTC/USD based on key technical levels and price action signals.🔍 Key Levels: Resistance / All-Time High Area: $105,000: Support Zone: Around $101,000: Sell Trade TP1: $99,000: Sell Trade TP2: $96,000: Final Target: $93,500: Critical Breakdown Level: $101,000 (Support)📌 Plan Breakdown🟦 Bearish Bias Setup:> The market is consolidating between $101,000 support and $105,000 resistance, forming a range-bound structure near all-time highs.> A breakdown below $101,000 support with a confirmed candle close below that level would trigger a sell signal.> Rewritten chart note:If the price breaks below the $101,000 support area and a candle closes beneath it, we can consider initiating a sell trade.🔽 Downside Path:: If the price breaks the support:: First target: $99,000 — minor support.: Second target: $96,000 — highlighted range zone.: If the price breaks below $96,000, expect further downside toward $93,500 (final target).🔄 Sideways Possibility:: If the price breaks below $101,000 but fails to push through $96,000, the market may range between $96K–$99K before choosing a direction.: The purple box (around $96K) is expected to be choppy — a break below confirms strong bearish continuation.
