
Advanced-Invest
@t_Advanced-Invest
What symbols does the trader recommend buying?
Purchase History
پیام های تریدر
Filter
Signal Type

Advanced-Invest
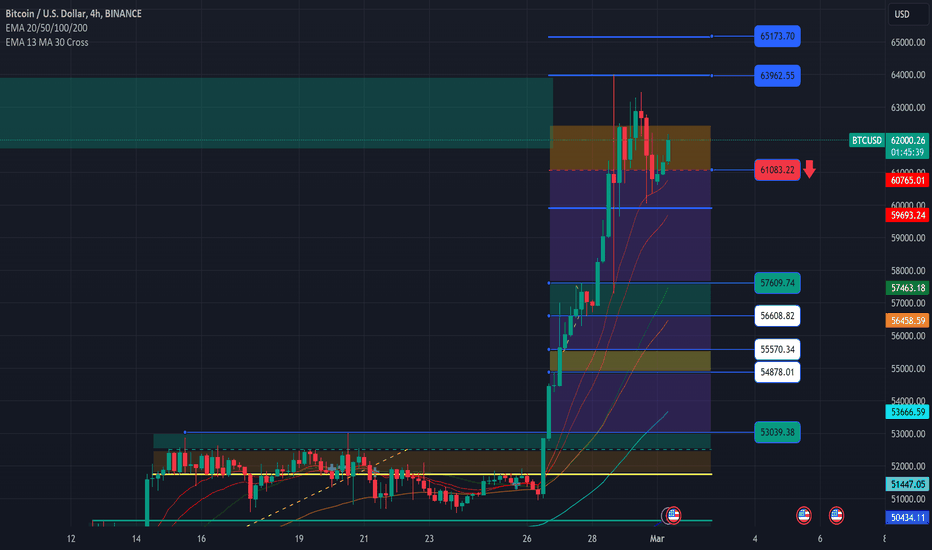
Good morning everyone, the Bitcoin is maintaining its positive momentum and is currently on its way to fill the Wick to the upside at around $64,000. Our structures remain quite fragile as we have exactly 2 support levels in the current chart image. The 1st support level is within our current range (orange box) between around $61,000 and $62,500, with the latter being something we still need to surpass. The 2nd support level is at the end of the downward Wick in the Support Box (green box) starting from $57,600. Volume-wise, we only get support again in our former range at $52,000 after this area. Looking at the indicators, they are all overwhelmed, but our EMAs are slowly moving towards crucial support zones: the 20 EMA is above our Support Box, and the 50 EMA is gradually heading into this area. Observing the 100 EMA, we notice that it is slowly leaving the old range and pulling into our parabolic rise, but it will take some time to reach relevant levels. With the current momentum, I expect green numbers today as well, but I would be cautious around $64,000, as the first orders were placed there, and therefore, a significant amount of liquidity (blue lines) has accumulated above this level. It remains exciting, and our all-time high (ATH) is getting closer. Do you think we can reach it without a correction. If you have any questions, I'm always available in the trading-chat. Until then, I wish you a successful Trading day!

Advanced-Invest
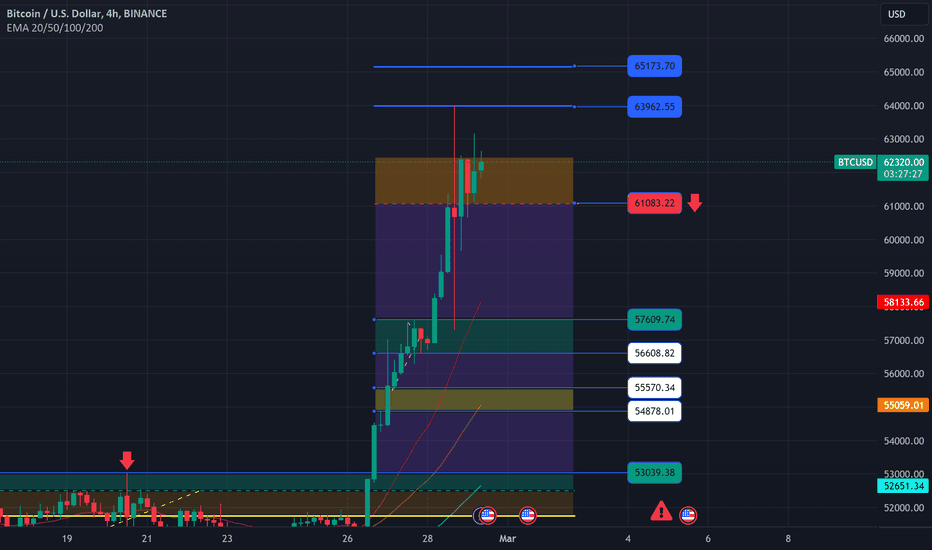
Good morning! 🌞 Bitcoin maintains its positive momentum and is currently on its way to fill the upper Wick at around $64,000. Our structures remain quite fragile, as we have exactly 2 support levels in the current chart. The 1st support level is within our current range (orange box) between approximately $61,000 and $62,500, with the latter still to be surpassed. The 2nd support level is at the end of the downward Wick in the support box (green box) starting from $57,600. Volume-wise, we only get support again in our former range at $52,000 after this area. Looking at the indicators, they are all overwhelmed, but our EMAs are slowly moving towards important support zones. The 20 EMA is above our support box, and the 50 EMA is gradually moving into this area. Examining the 100 EMA, we notice it is slowly leaving the old range and entering our parabolic rise. However, it will take some time before it reaches significant levels. Given the current momentum, I expect green numbers today, but I would be cautious around $64,000, as the first orders were placed there, accumulating a significant amount of liquidity (blue lines) above this level. It remains exciting, and our all-time high (ATH) is getting closer. Do you think we can reach it without a correction? If you have any questions, I'm available in the trading-chat at any time. Until then, I wish you a successful BTCUSD Trading day! 🚀💹

Advanced-Invest
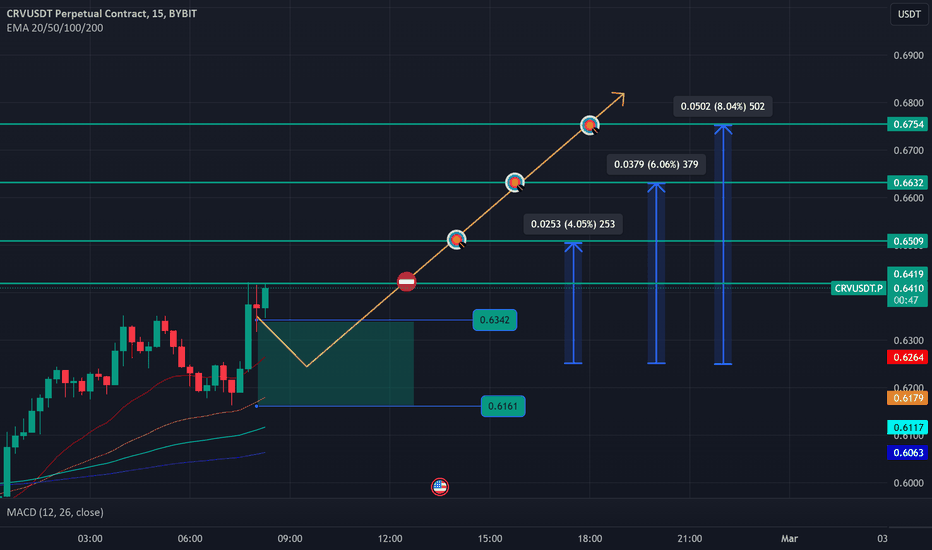
💭 New Tarding Idea ✴️ Pair: #CRV/USDT ↕️ Direction: LONG 🟩 Entry : $0.6342 - $0.6161 TP #1: $0.6419 TP #2: $0.6509 TP #3: $0.6632 TP #4: $0.6754 ⛔️ Stop loss: individual 💫 Hebel: 5x - 20x

Advanced-Invest
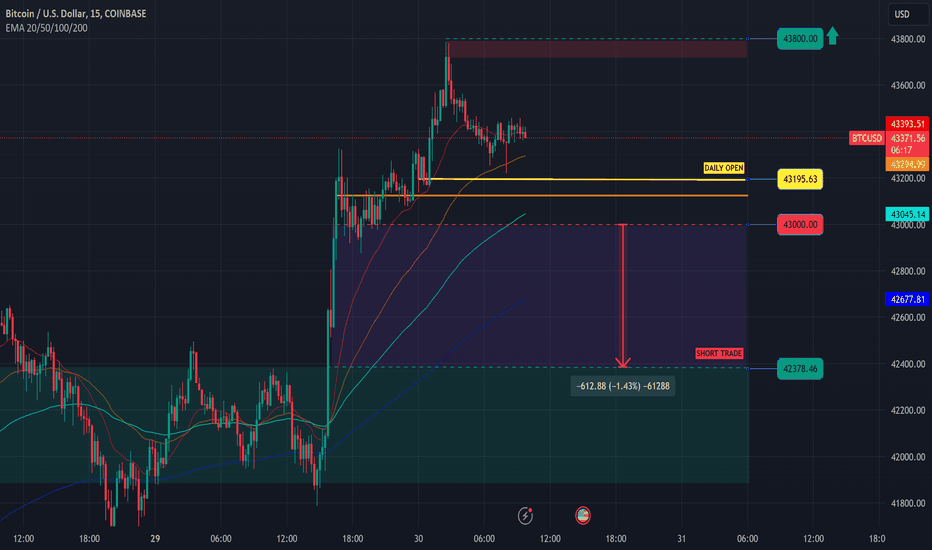
Good morning, here are a few potential trades in the 15-minute chart. Currently, we are struggling at the 20 EMA after establishing our high (green line above) at $43,800 with a so-called Double Top (bearish pattern). While this high is a resistance area, it is not particularly strong, making it relatively easy for us to surpass. Once we have crossed this level, I am quite confident that the 1st vector candle from the 4-hour chart will be in trouble, which is why I am ready for a LONG position here. It's important to keep in mind the uncertainty in the chart due to the liquidity below us, which we could use to our advantage. If we fall below $43,000 through the 100 EMA (red line), I expect that we will be caught again in the Low Volume Zone (purple box) and only find support in the Support Box (green box).

Advanced-Invest
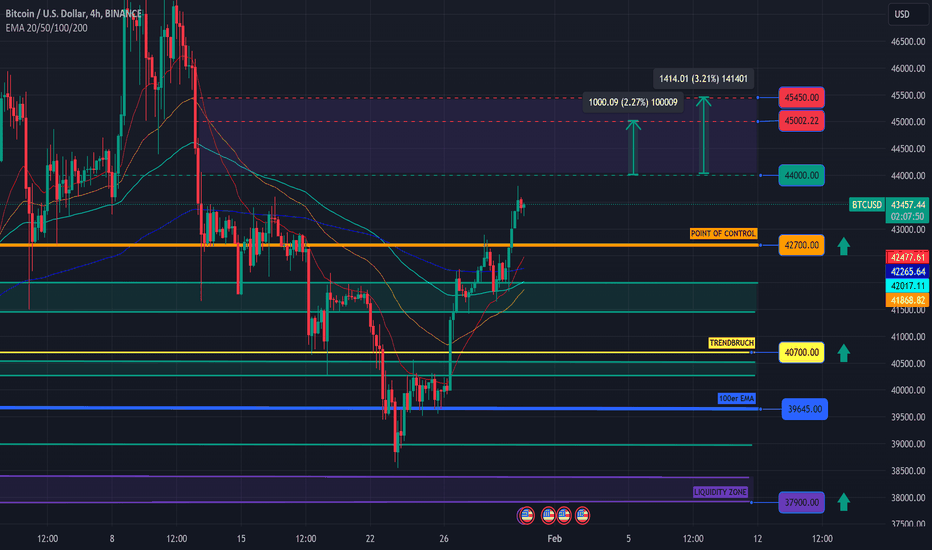
Good morning, we continue to hold steady around $43,500, but is the upward momentum sufficient for another breakout?

Advanced-Invest
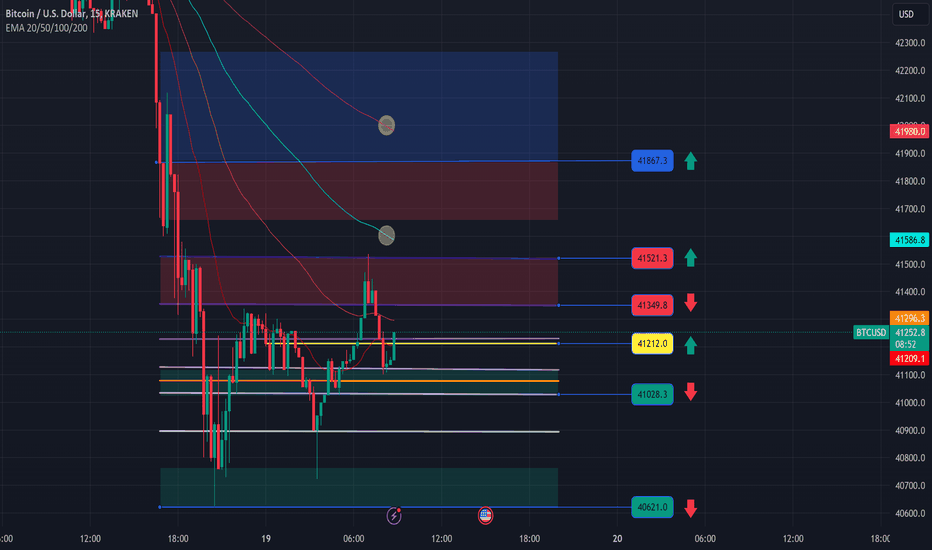
Good morning TraDing ! 🌅 After yesterday's sudden crash, Bitcoin has entered another consolidation phase and is currently trading at $41,150. We are currently in the 15-minute chart, where you can clearly see that the first attempt to break out has already failed at the $41,500 resistance (red box above). 📉 After forming a "Swing High" there, we dropped through the 50 and 20 EMA as well as the Daily Open (yellow line), which is currently at $41,210 today, and were then caught by our POC (orange line). In the larger time frames, everything seems to point upwards, but we are facing the familiar problem again: There is more resistance above us than support below us. As long as we hold our current support (green box above) and do not fall through the crucial support of $40,700, the chances for a price increase remain relatively high. However, if we break this support, we may enter the $38,000 range due to the Minus Distribution. An ideal scenario would be if we could quickly establish ourselves above $41,300 again. This support should be sufficient to attempt a second breakout from the resistance and the 100 EMA. Find out more in the following video market update. If you have any questions in between, I'm available in the trading-chat. 💬

Advanced-Invest
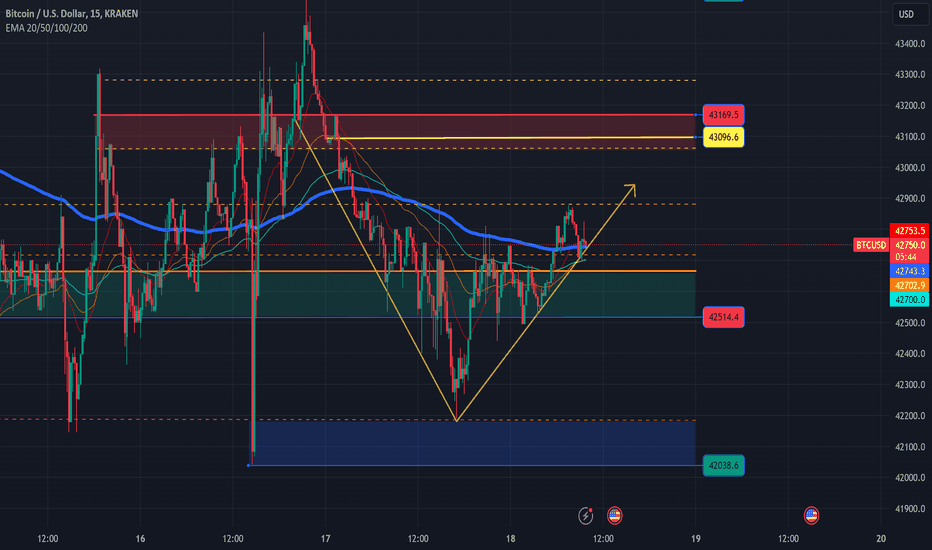
Good morning, let's also take a look at the subordinate 15-minute chart. Until yesterday evening at 5:00 pm, we had extreme downward momentum here. After reaching a new internal high of around $43,500, Bitcoin was only sold off after the closing of the American markets. This was due to the wick formed during the first dump or liquidity grab, caused by Grayscale sales. Liquidity was largely taken out there, and afterwards, we experienced a beautiful price reversal. Currently, in the 15-minute chart, we find ourselves in a very favorable situation above the crucial support (green box), the Point of Control (orange box), and even the 200 EMA. If we could now form a new internal high above the rejected FIB, this would be a very bullish sign. Should we now start to erode our progress again, of course, the opposite. We'll know more in an hour!

Advanced-Invest
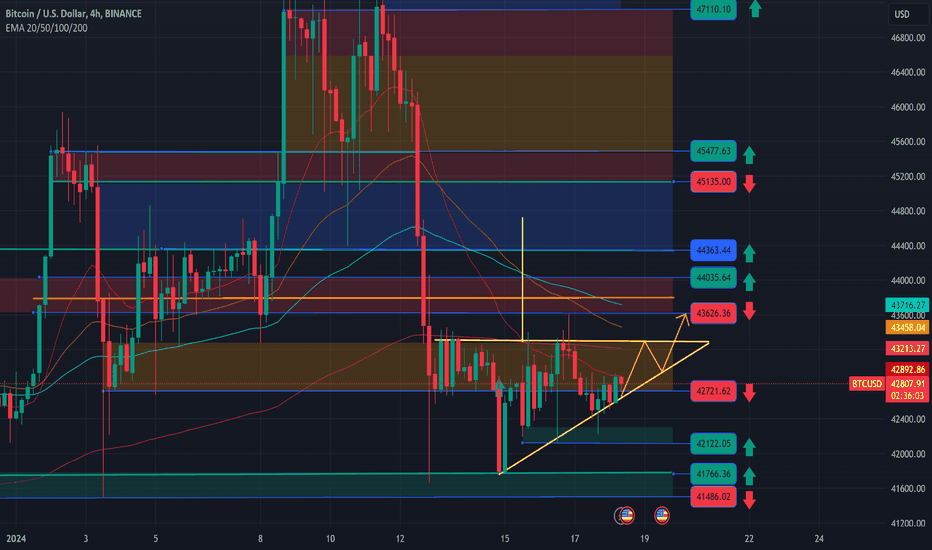
Good morning, the market updates are becoming a bit dull as the market isn't moving at all; we are back at the same starting point as yesterday. Trapped within the range (🟠orange box), Bitcoin continues to consolidate around $43,800, where we are currently facing strong pressure from our 20 EMA. 📊 Due to the unbreakable resistance of the 200 EMA and the persistent upward pressure, Bitcoin has formed an "Ascending Triangle" pattern (🟡yellow triangle) on the 4-hour chart. This is a bullish continuation pattern with a technical price target of over $44,500, which would break any bearish structures. Such a pattern often occurs after significant movements and usually breaks out in the third quarter, which in this case would be on Saturday or possibly even Friday. A small issue or opportunity is the aforementioned 20 EMA. We are at the lower trendline of this pattern and are currently being pushed down by the 20 EMA. Either we break this today decisively or fall out of our pattern. 👀 However, other indicators generally show us upward momentum, and the MACD indicates new positive momentum after a small momentum dip. The next few hours will provide us with a crucial trend, determining the direction in which we break out. The analysis in the 15-minute chart may provide even better insights. 🤝

Advanced-Invest
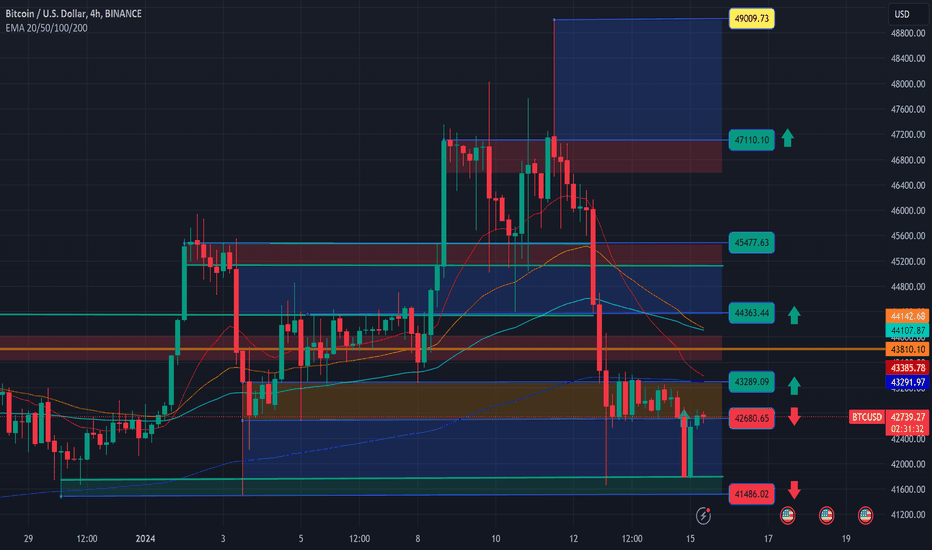
Good morning, new week, new luck. Bitcoin is trading below its range (orange box) at around $42,700 and doesn't seem to want to rise. After the bumpy start of the Bitcoin ETF and the so-called "Bulltrap" on the first trading day, Bitcoin was heavily sold off and pretty much broke every internal support. In the end, exactly the scenario we talked about for days has occurred: the wicks in the $42,000 range have been filled, but this happened, of course, when almost no one expected it anymore. Now, over the weekend, we have been in a range (orange box) from which it is difficult to break out above. This could be because we are getting very strong resistance from our 200 EMA, which will soon be supported by the 20 EMA. Directly above us, our POC (orange line) is still in a very strong resistance zone (red box), which will also be supported very soon by the 50 and 100 EMA. However, the RSI indicates that we are oversold, which could give us some upward momentum. Also, the MACD is about to make a "bullish cross." In addition, a significant amount of liquidity has naturally accumulated above us, which must be picked up sooner or later. The American markets are closed today, which could work in our favor. More on this in the following video market update. Until then, I wish you much success!

Advanced-Invest
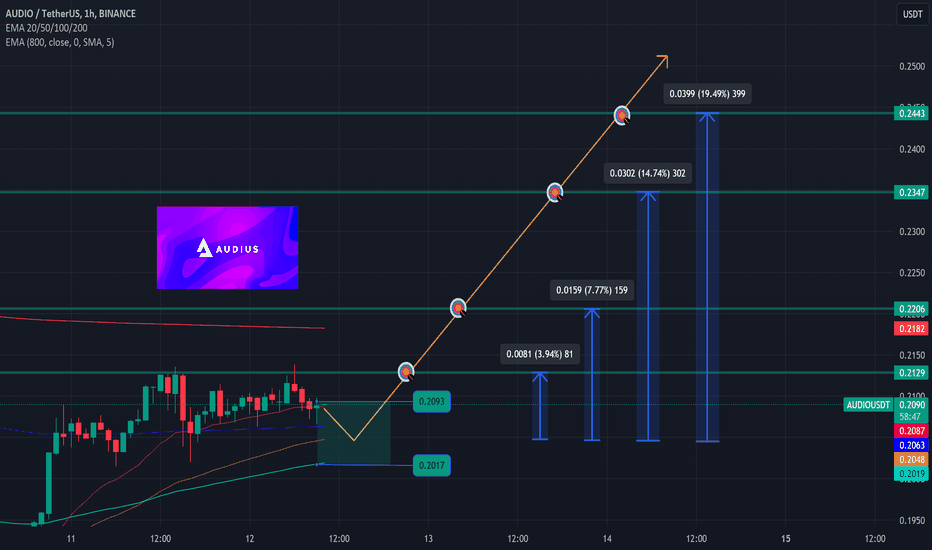
Neue Trading Idee Pair: #AUDIO/USDT Direction: LONG Entry : $0.2093 - $0.2017 TP #1: $0.2129 TP #2: $0.2206 TP #3: $0.2347 TP #4: $0.2443 Stop loss: 0.1990 Hebel: 5x - 20x AUDIO hat eine große Wick im Chart perfekt gefüllt und macht sich aktuell auf den Weg eine riesige Imbalance, welche bei TP #4 endet, aufzulösen. Auch wenn der Bitcoin kurzfristig Short aussieht, bin ich zuversichtlich, dass AUDIO diese Bewegung früher oder später abschließen wird
Disclaimer
Any content and materials included in Sahmeto's website and official communication channels are a compilation of personal opinions and analyses and are not binding. They do not constitute any recommendation for buying, selling, entering or exiting the stock market and cryptocurrency market. Also, all news and analyses included in the website and channels are merely republished information from official and unofficial domestic and foreign sources, and it is obvious that users of the said content are responsible for following up and ensuring the authenticity and accuracy of the materials. Therefore, while disclaiming responsibility, it is declared that the responsibility for any decision-making, action, and potential profit and loss in the capital market and cryptocurrency market lies with the trader.