
Adoamigo
@t_Adoamigo

What symbols does the trader recommend buying?
Purchase History
پیام های تریدر
Filter
Adoamigo
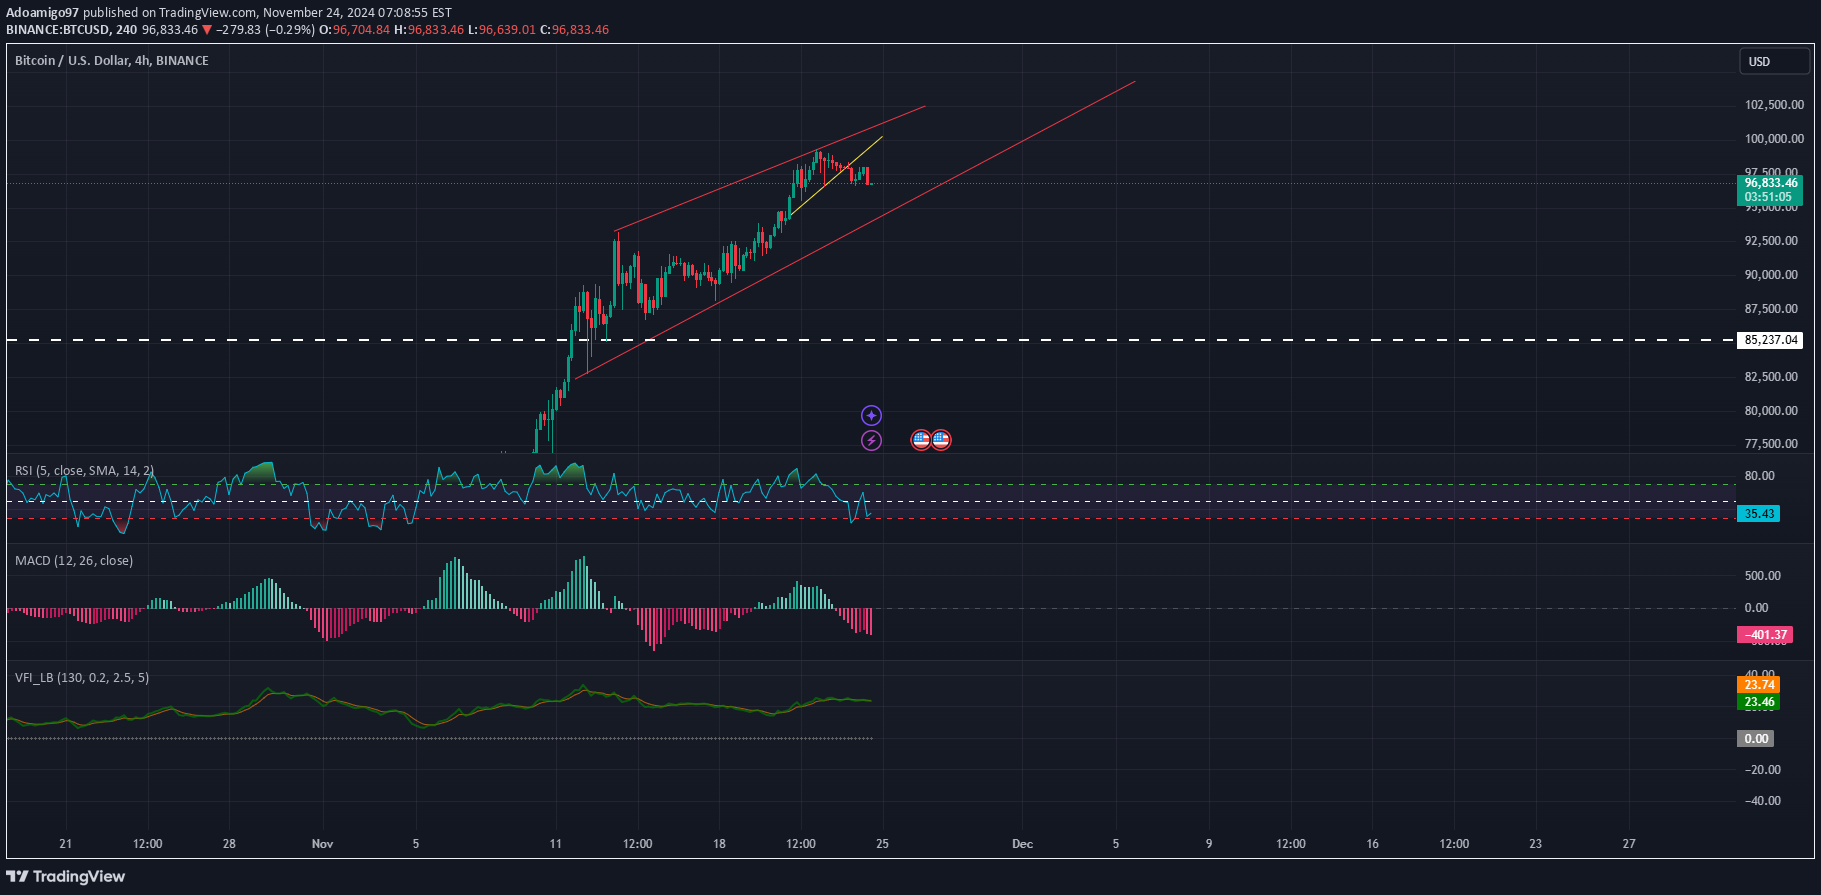
#2 Danger BTC is falling

Bearish Outlook and Macro PerspectiveAs in my previous remarks, I signaled an unstable #100k level, which has developed into a failure even to touch this mark. This reflects a loosening in bullish momentum, as many holders and investors are now taking profits. It's important to remember that there are also long-term holders (over 5 years) who experienced losses of up to #77% since November 2021. These holders might now be exiting their positions, adding selling pressure to the market.Moreover, with speculation surrounding Trump's actions post-20 January next year, it’s wise to approach the market cautiously and avoid wild bets. There are still lagging opportunities in other sectors. For example, Cardano (ADA) recently posted #38% gains in two weeks, highlighting alternative investments that are catching up to the current crypto bull run.Bitcoin Analysis: Bearish Outlook and Short-Term TargetsPosition Details:Current Sell Entry: #97kTarget: #90kMarket Structure Overview:The price action is respecting a rising wedge pattern, which is generally a bearish continuation pattern. The breakdown seen near the current price (~#94k) aligns with your bearish outlook.Bearish Confirmation:RSI: The RSI has fallen below neutral (currently #34.06), signaling weakening momentum.MACD: The MACD histogram shows growing bearish momentum (red bars) alongside a bearish crossover.Volume Flow Index (VFI):The VFI at #20 suggests moderate capital flow into the market, but not sufficient to sustain bullish trends.Short-Term Target: #90kThe primary target remains #90k, supported by:The wedge breakdown projection aligning with this level.Historical support zones evident on the chart.December Scenario: Potential Retest or BreakoutHeading into December, two possible scenarios are likely:Scenario A: Retest as a Double TopA rebound could take the price back to #97k or higher, potentially forming a double top. Rejection here would confirm continued bearish pressure.Scenario B: Breakout to #100k-#102kIf bullish momentum unexpectedly revives, a breakout to #100k-#102k could occur. However, this would likely represent a false breakout, followed by a deeper decline.Technical Outlook:Key Resistance Levels:#96k (current zone of interest).#100k-#102k (psychological resistance and possible retest zone).Key Support Levels:#90k (primary target).#85k (potential deeper breakdown area).Conclusion:The current analysis reinforces a bearish short-term outlook, with a sell position targeting #90k. December may bring increased volatility with a possible retest at #97k or a breakout to #100k-#102k before the downward trend resumes. This cautious approach is underscored by macro factors such as profit-taking from long-term holders and alternative opportunities, like Cardano’s recent #38% gains, still lagging the broader crypto bull run. Stay vigilant with key levels and monitor confirmation signals from RSI and MACD.
Adoamigo
|Danger|Don´t expect a stable 100k level
Bitcoin (BTC/USD) on a 4-hour timeframe, exhibiting significant recent bullish momentum with some indications of a possible bearish retracement. Below is a detailed analysis:1. Price Action and Channel FormationAscending Channel: The price is trading within an ascending channel, which often acts as a bullish pattern. However, it has recently touched the upper trendline and appears to be rejecting it, suggesting resistance at higher levels.Bearish Reversal Signals: If the price breaks below the midline or lower boundary of the channel, this could confirm a bearish turn.2. Relative Strength Index (RSI)Current Level (65.71): The RSI indicates slightly overbought conditions but hasn't reached extreme levels (>70). A downward crossover of RSI below 50 could confirm increasing bearish momentum.Watch for Divergence: Monitor for bearish divergence, where price forms higher highs while RSI forms lower highs, signaling weakening bullish strength.3. Moving Average Convergence Divergence (MACD)Current Signal: The MACD histogram is decreasing, with the signal line likely converging with the MACD line. A bearish crossover here would indicate a potential shift in momentum.Downtrend Momentum: If the histogram moves into the negative territory, it would strengthen bearish signals.4. Volume Flow Indicator (VFI)Current Status (3.92): Positive but flattening, which might indicate diminishing buying pressure. If the VFI turns negative, it could confirm selling dominance.5. Key Levels to WatchSupport Levels:$92,000: Near-term support, corresponding to recent consolidation zones.$85,000: Critical support level. A break below could trigger further downside, potentially signaling the end of the bullish structure.Resistance Levels:$97,000: Strong resistance, as seen from rejection at the top of the channel.6. Trading Idea: Bearish CaseTrigger for Bearish Move: Watch for:A breakdown of the ascending channel below $92,000.RSI dropping below 50.A bearish MACD crossover.Target Levels:First target: $85,000, as a major psychological and technical level.Secondary target: $75,000, aligning with prior consolidation zones and Fibonacci retracements.Conclusion:If the price breaks below $92,000 with confirming bearish signals from RSI, MACD, and volume indicators, it could validate a move toward $85,000. However, failure to break key support levels may suggest the bullish trend will continue.
Adoamigo
BTC SELLING ORDER READY AIMING 66.350

Technical Analysis UpdateSince reaching the 68,200 level on July 22, the price action has shown signs of a bearish trend. The RSI indicated a bearish signal, leading to a decline of 4,758 points or 6.97%. Currently, there are stronger signals at the moment suggesting that the uptrend is weakening, and the price action is approaching to break my drawn trendline.I have set a pending sell order at 67,800 with a target of 66,350. If the trendline and the MA50 are breached, we could see an extended selling spree towards my expectations. However, if the price action breaks my 68,400 stop loss and the 68,500 psychological resistance, there is potential for the price to reach 70k - 72k levels before the next bearish correction.Keep an eye on these key levels for potential trading opportunities.
Adoamigo
BTC Second Sell Order active aiming 64k level

BTC/USD Outlook: As I mentioned in yesterday's post, buying power is still visible but very limited. My entry point (Sell Stop) order has not yet been triggered, so I reopened a manual position at my initial stop loss level. I am confident that BTC will drop below the 64k level again. I will actively monitor the price action throughout Monday's session. If my Sell Stop order from yesterday is triggered today, I will close my second manual order, which I opened at the 67,552 level, in profit to minimize risk. I expect less volatility in today's session but will keep my stop levels tight. There could be strong movements this evening (Central European time), either resulting in a sharp drop or breaking the sideways movement to the upside that started on Friday.
Adoamigo
Bitcoin creating a divergence at resistance 64k ahead

Buying power in the BTC/USD pair appears to be very limited as it was rejected from the 67,350 - 66,500 resistance cluster. Additionally, there is a bullish divergence, leading me to expect the price action to retreat back to 64,500. I have set a pending sell stop order at 66,124, targeting 64,357 in the coming days. It is important to mention that I always aim to swing trade my Bitcoin positions for a few days until my move either works out or doesn't.
Adoamigo
Bitcoin loosing steam, 35K Levels for end of the year

Technical Analysis: The $64,075 resistance zone was tested, but concurrently, my medium-term selling orders around this level are about to be triggered with targets set at $51,513. I see increasing resistance in the $64,075 range, and despite the strong bearish candle sequence on the chart, Bitcoin remains neutral to bearish. It is currently teetering around the 200-day moving average, which serves as a critical support level as the U.S. session approaches. However, the $51,513 - $35,566 range is now a significant support zone, established by the daily chart’s candlestick configuration. Bitcoin has struggled to break above its recent highs, indicating weak bullish momentum. I still haven't received confirmation for a short-term re-sell opportunity, and it is not advisable to enter the market without tight risk management, given the rejection of recent correction attempts due to fundamental buying pressure. Monday’s session opening on Wall Street could have a bearish impact on Bitcoin. My selling bias remains unchanged as I treat bullish spikes as temporary, with potential for a new aggressive bearish takedown. Bitcoin is extending sideways action, following the continuation of the former daily chart’s descending channel, as market sentiment remains cautious (fears of economic instability and strong dollar pressure). Pisition: Observe how Bitcoin's strong re-selling level of the $64,075 zone is critical, with possible volatile swings. Currently, Bitcoin is in a short-term downtrend and remains very sensitive to every bearish development. I am highly skeptical and hold strong reservations about Bitcoin’s recent recovery, as I don’t believe that buyers will see a continuation of this trend. On the other hand, there is no significant factor to push Bitcoin upwards again besides critically bearish technicals, so I will await a retest of the $64,075 level to re-sell Bitcoin towards the $51,513 benchmark first, then $35,566 in extension. I do expect a significant decline ahead for Bitcoin, which can extend my excellent trading results on re-sell orders I have been operating with. Patience is required.
Adoamigo
BITCOIN IS RECOVERING 28k LEVEL IN SIGHT

BITCOIN IS RECOVERING 28k LEVEL IN SIGHT #Bitcoin is beginning to recover as it approaches the $26,000 level, forming a valid trendline after rejecting the previous $25,000 level (Bullish Orderblock). The current price action is approaching a crucial resistance cluster between $27,300 and $27,500, and there is a healthy daily candle above the EMA 50. The price action broke through the EMA´s 50 & 200 Golden Cross on September 23rd. If this break continues into the next week, I´m expecting Bitcoin to reach at least the $28,000 level as an R1 pivot level. If $28,000 is broken aggressively, there is a good chance of Bitcoin returning to $30,000 again in mid-October. However, if the price action somehow breaks the $24,800 level, there could be further losses for Bitcoin, and a potential turning point is around $24,000, which would represent a bearish trend formation if it breaks. Stay updated with Bitcoin at: blog.bitcoin.com/
Adoamigo
The BITCOIN path before the halving?

The BITCOIN path before the halving? It's been a while since my last forecast on BTC. This year we experienced significant changes, positive for BTC. Anyway, the price action is slowly entering consolidation between the 25100 - 31000 range. As the blockchain improves (faster and more secure transactions, with much lower gas fees) and the halving is approaching in less than a year, the signals are all towards a positive BTC. I have set some parameters on my chart that are key for me and my current feeling is that by the end of August we could see the price around 40-50k. By the way, below is my last Post on BTC from December 2022. If you have any questions feel free to reach out. Many waves, Adnan! If you have any questions feel free to reach out. Many waves, Adnan! "The Lightning Network Solution for Bitcoin We can’t forget about the Lightning Network—the layer-2 protocol that holds the keys to making Bitcoin transactions faster and cheaper. This nifty scaling solution is buzzing with potential, offering a glimmer of hope to alleviate Bitcoin’s congestion issues. As more users hop on the scaling solution bandwagon, the congestion plaguing Bitcoin’s network might finally find some relief. This would undoubtedly result in a decrease in the base layer’s transaction activity as users migrate to the second-layer solutions. But, alas, nothing is perfect in the world of technology. Even the Lightning Network has its own set of hurdles to clear before it can conquer the masses. Technical challenges, such as routing issues and channel capacity constraints, have proven to be sticking points for some users. And let’s not forget the daunting task of setting up a Lightning node, which can leave non-technical users scratching their heads. While Bitcoin’s recent decline in network activity raises valid concerns, it also serves as a reminder of the importance of finding viable solutions to ensure the scalability and sustainability of blockchain networks. The cryptocurrency community remains optimistic as developers continue to innovate and tackle the challenges head-on."
Adoamigo
Buying power is slowly evaporating at resistance

It is now clear to us that gold is in unnatural trading conditions. The increase in interest rates in addition to the dovish stance, the market has turned to the bears and the buying power is slowly evaporating. However, I'm currently waiting for a breakout to give us a clear direction. In the next week, I am waiting for the support zone to be broken on the chart and if the level 1766.31 is broken, I will sell gold around that price until 1746.90. I am currently lowering my Risk from 2% to 0,5%, due to my last two stop loss activations, until the dust settles and gold is a little clearer.Good luck traders.
Adoamigo
Golds Stop loss Hit, new buy order at same level

UPDATE: My stop loss was triggered, the mistake was where I selected my stop loss at a narrow level, due to high volatility. The gap between Inflation rates and Mr. Powell's speech was enough to keep the price going lower, unfortunately so the candlepin poke my stop loss. The gap I`m rebought gold at my Stop loss level as I expect Fed dovish. The Targets remain the same. 10 p Loss on this one.
Disclaimer
Any content and materials included in Sahmeto's website and official communication channels are a compilation of personal opinions and analyses and are not binding. They do not constitute any recommendation for buying, selling, entering or exiting the stock market and cryptocurrency market. Also, all news and analyses included in the website and channels are merely republished information from official and unofficial domestic and foreign sources, and it is obvious that users of the said content are responsible for following up and ensuring the authenticity and accuracy of the materials. Therefore, while disclaiming responsibility, it is declared that the responsibility for any decision-making, action, and potential profit and loss in the capital market and cryptocurrency market lies with the trader.