
ActuaryJ
@t_ActuaryJ

What symbols does the trader recommend buying?
Purchase History
پیام های تریدر
Filter
ActuaryJ
XAUUSD: 15 Aralık Piyasa Analizi ve Stratejisi.
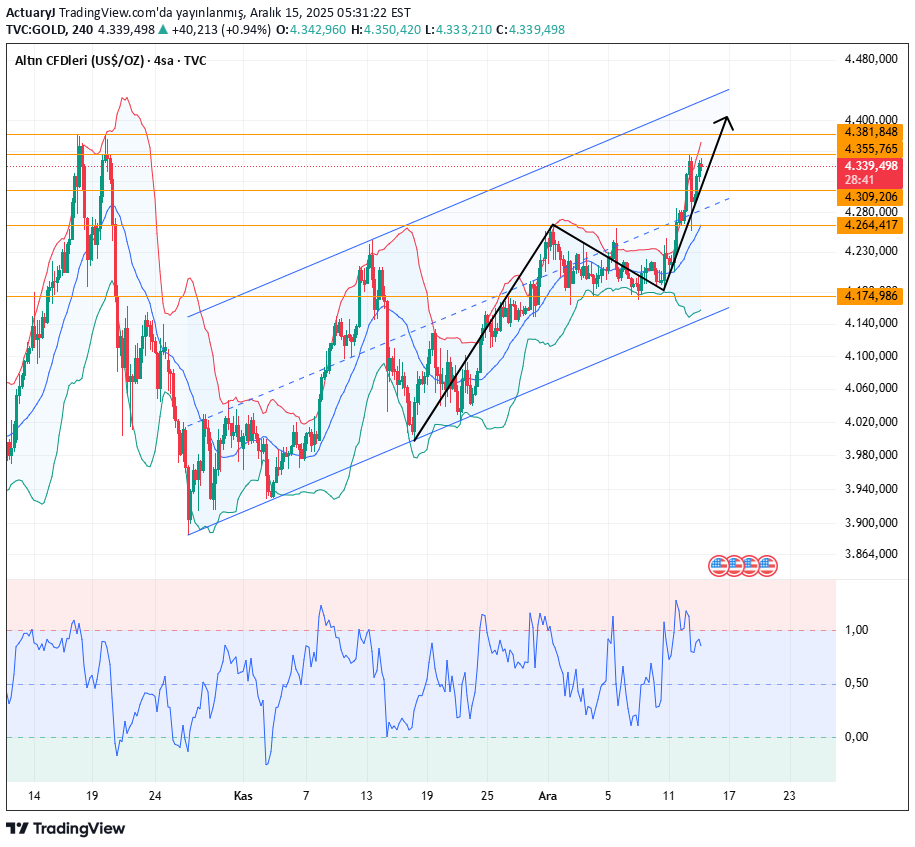
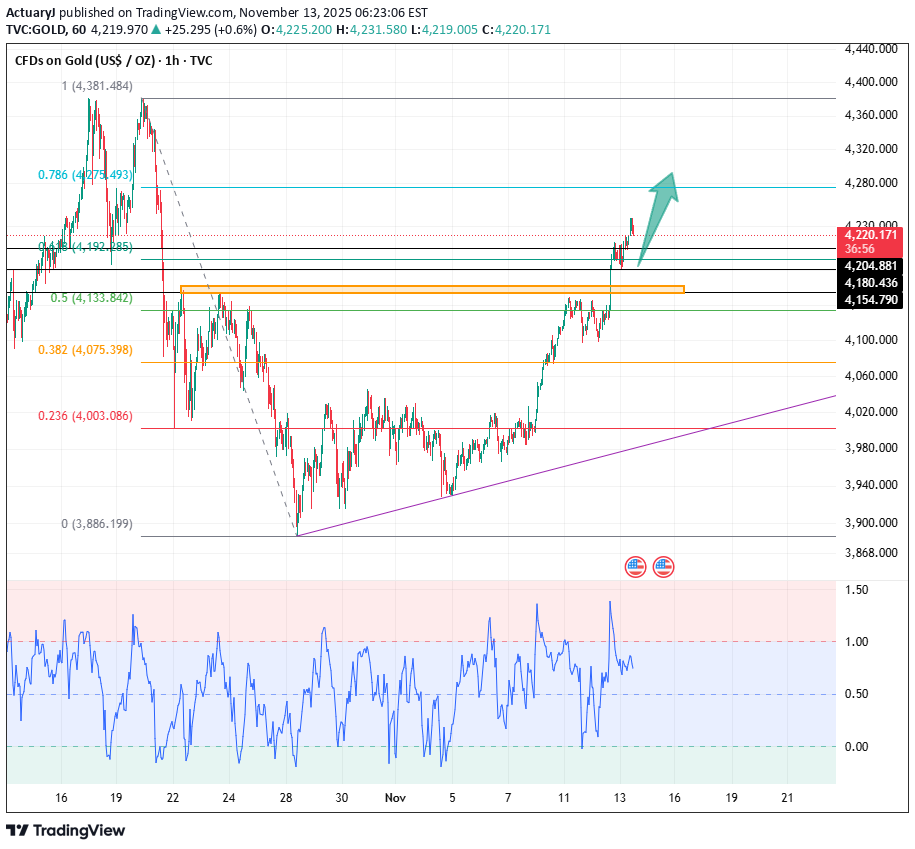
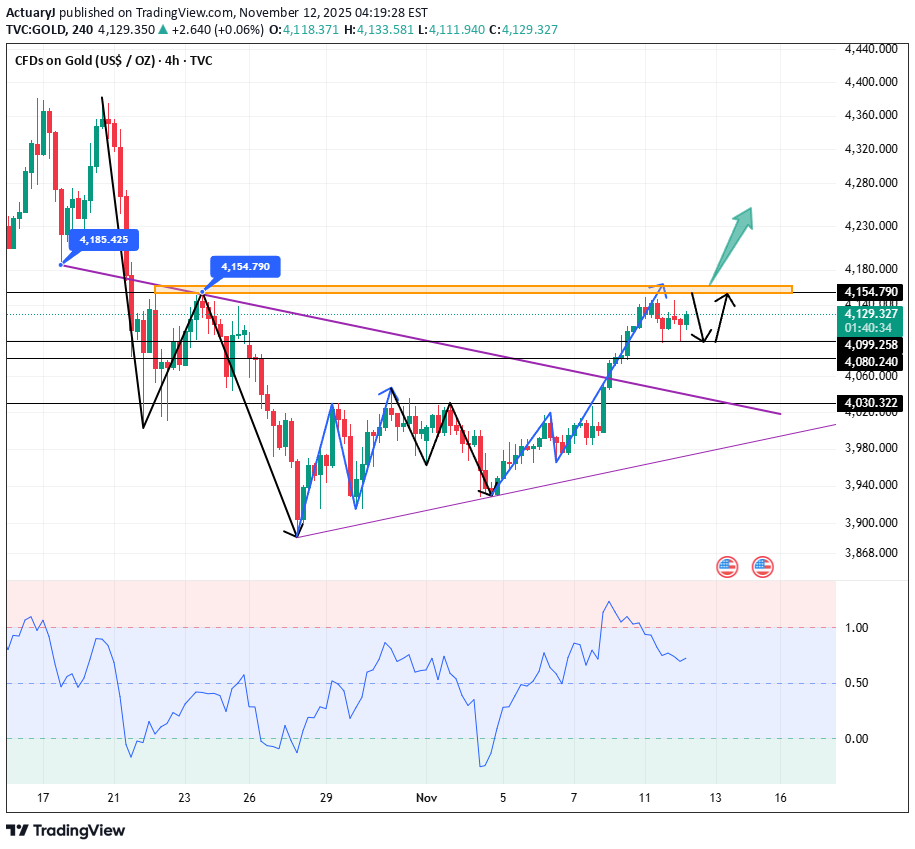
Altın Teknik Analizi: Günlük Direnç: 4382, Destek: 4175 4 Saatlik Direnç: 4355, Destek: 4265 1 Saatlik Direnç: 4353, Destek: 4309 Altın, piyasa açılışından bu yana neredeyse hiç geri çekilme olmadan yükselişini sürdürüyor ve uzun vadeli yükseliş pozisyonlarında bulunanların güvenini daha da güçlendiriyor. Günlük grafik, altın için güçlü bir performans gösteriyor ve beş gün üst üste kazanç sağlıyor. Hareketli ortalamalar yukarı doğru kesişiyor, destek kademeli olarak yükseliyor ve Bollinger Bantları yukarı doğru genişliyor, bu da fiyatın yukarı yönlü bir kanal içinde olduğunu gösteriyor. Kısa vadeli destek 4309 civarında. 1 saatlik grafik "V şeklinde" bir geri dönüş gösteriyor. Fiyat, geçen Cuma günkü en yüksek seviye olan 4353 civarındaki direnci izliyor. Bollinger Bantları genişliyor ve hareketli ortalamalar yükseliş yönünde hizalanıyor. Bugün yükseliş trendi öneriliyor. Ancak, MACD/KDJ göstergelerinde sapma sonrasında geri çekilme riskine dikkat edin. Direnç, geçen Cuma günkü en yüksek seviye olan 4353 ve önceki tarihi en yüksek seviye olan 4381 civarında görülüyor. Piyasa haber verilerini bekliyor; eğer geçen Cuma günkü en yüksek seviyeyi aşamazsa, muhtemelen konsolidasyon aşamasına devam edecektir. Alım Satım Stratejisi: AL: 4306~4309 Satış şu anda düşünülmüyor; satış yapmadan önce çift tepe formasyonunun onaylanmasını beklememiz gerekiyor. Daha Fazla Analiz →
ActuaryJ
XAUUSD: Market Analysis and Strategy for December 15th
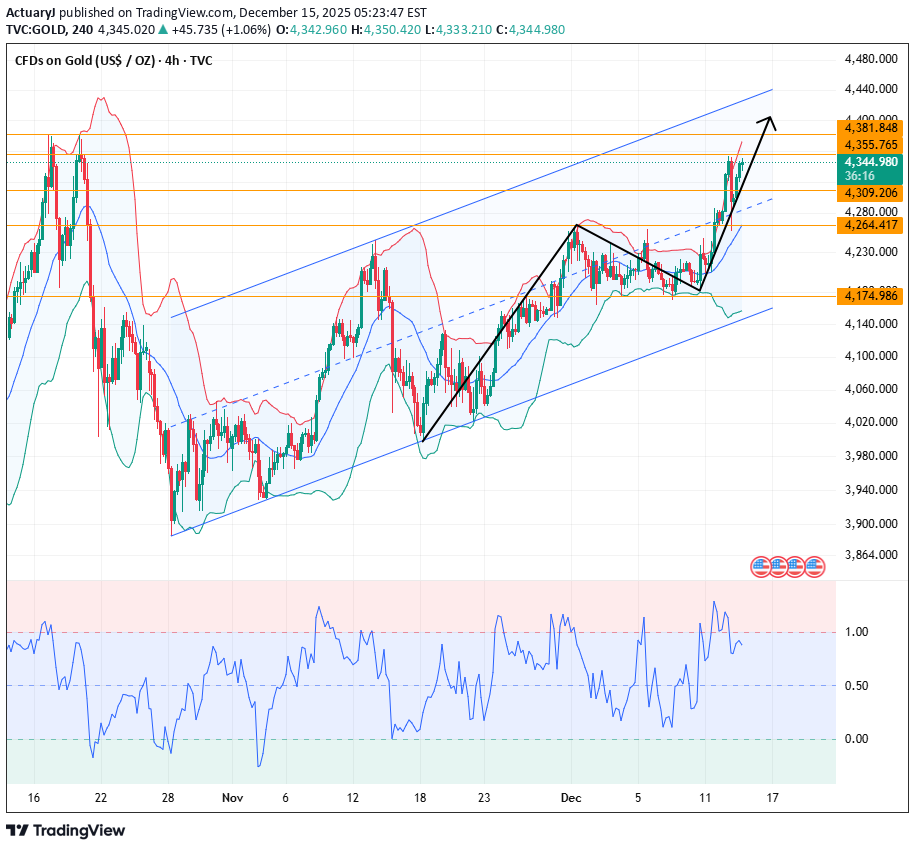
Gold Technical Analysis: Daily Resistance: 4382, Support: 4175 4-Hour Resistance: 4355, Support: 4265 1-Hour Resistance: 4353, Support: 4309 Gold has been rising since the market opened today, with almost no pullback, further strengthening the confidence of those holding long-term bullish positions. The daily chart shows strong performance for gold, with five consecutive days of gains. Moving averages are crossing upwards, support is gradually moving higher, and the Bollinger Bands are widening upwards, indicating the price is within an upward channel. Short-term support is around 4309. The 1-hour chart shows a "V-shaped" rebound. The price is watching the resistance around last Friday's high of 4353. The Bollinger Bands are widening, and the moving averages are in a bullish alignment. Today, a bullish trend is recommended. However, be aware of the risk of a pullback after a divergence in the MACD/KDJ indicators. Resistance is seen around last Friday's high of 4353 and the previous historical high of 4381. The market is awaiting news data; if it cannot surpass last Friday's high, it will likely continue its consolidation phase. Trading Strategy: BUY: 4306~4309 Selling is not currently being considered; we need to wait for confirmation of a double-top pattern before selling. More Analysis →A head and shoulders pattern appeared on the 15-minute chart.
ActuaryJ
تحلیل طلا (XAUUSD) امروز: استراتژی خرید و فروش با سطوح کلیدی 4000 و 4150
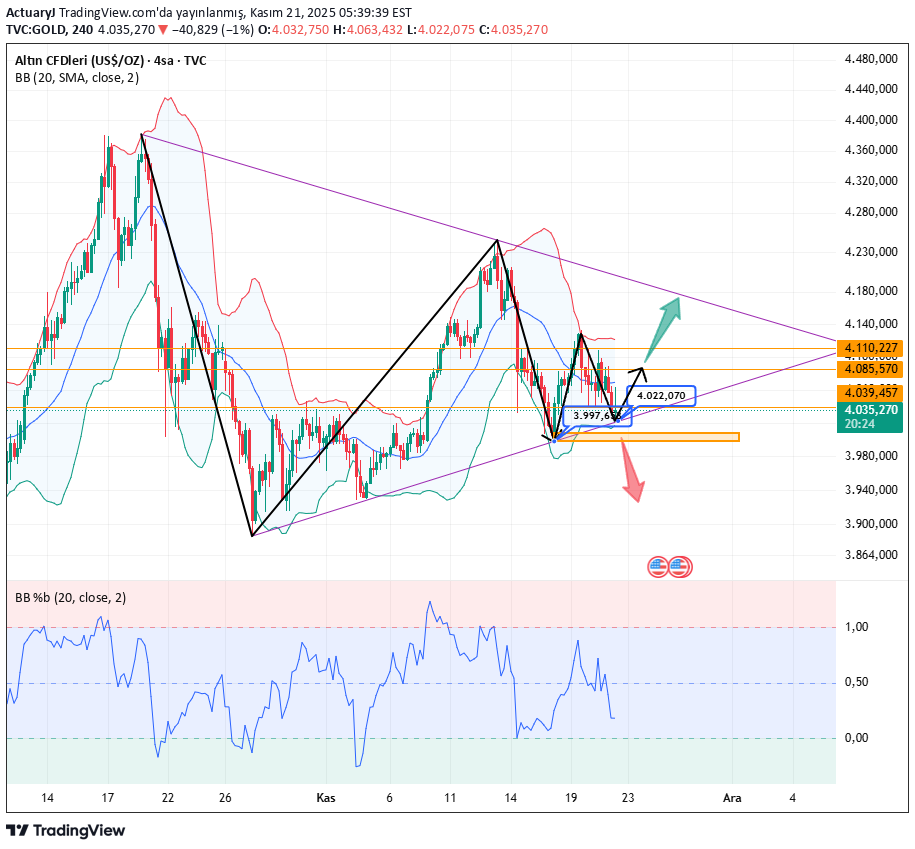
Altın Teknik Analizi: Günlük Direnç: 4150, Destek: 4000 4 Saatlik Direnç: 4110, Destek: 4010 1 Saatlik Direnç: 4085, Destek: 4020 Teknik olarak, haftalık grafiğin bugün bir doji ile kapanması muhtemel. Dünün günlük grafiği bir doji ile kapandı ve bu da kısa vadeli yükseliş trendinde yavaşlamaya işaret ediyor ve yatay konsolidasyon beklentisini artırıyor. Bollinger Bantları da daralıyor ve 4040 destek seviyesinin etkinliğinin bugün takip edilmesi gerekiyor. Bu arada, 4000 seviyesi tekrar test ediliyor. 4020 kırılırsa, kısa vadeli bir satış sinyali alınabilir. Fiyat 4085'in üzerinde tutunabilirse, 4140/4150 bölgesinin tekrar izlenmesi gereken bir alım sinyali alınabilir. Uzun vadeli yatırımcılar, 3930/3920 seviyeleri civarında alım fırsatları arayabilir; 1 saatlik grafiğe bakıldığında, altın Avrupa seansının ardından toparlandı, ancak 4080 seviyesinin altına inmesinin ardından kısa vadede daha fazla düşüş olasılığı var. 4020 civarında destek arayın; Avrupa ve Amerika seansları için, 4005/4000 civarında bir istikrar sinyali gelirse alım yapmayı düşünmek planlanıyor. İşlem Stratejisi: SAT: 4078~4085. ALIŞ: 4005~4000. Daha Fazla Analiz →
ActuaryJ
تحلیل طلا (XAUUSD): نقطه عطف حساس بازار و استراتژی معاملاتی ۱۸ نوامبر
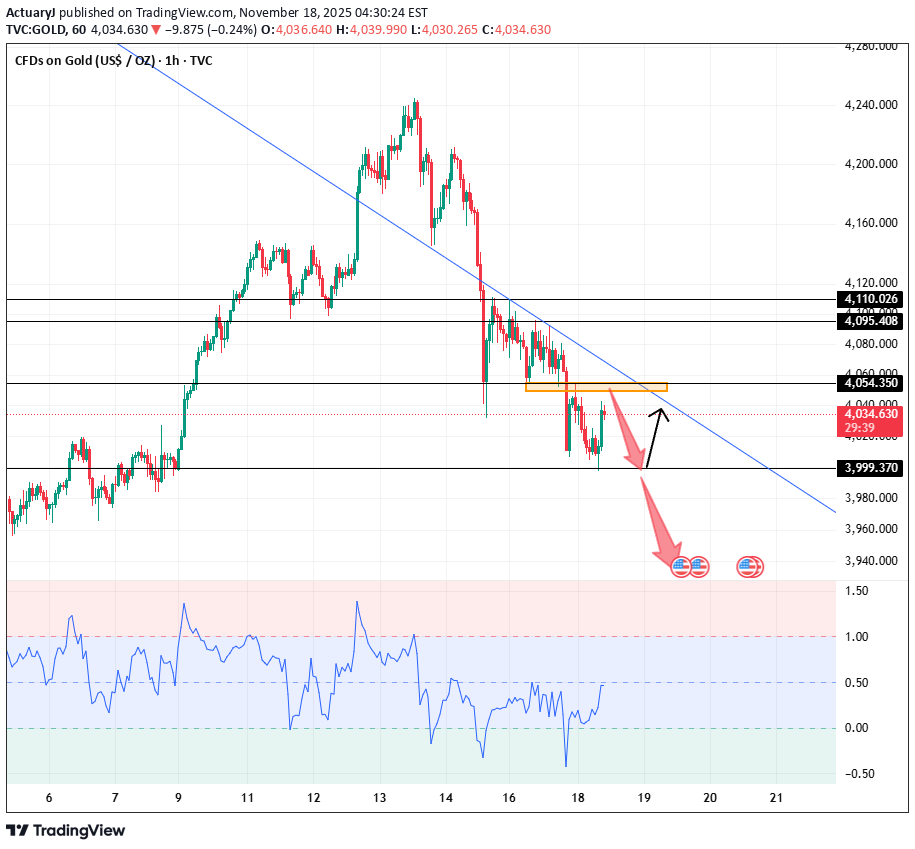
Gold Technical Analysis: Daily Resistance: 4110, Support: 3930 4-Hour Resistance: 4095, Support: 4000 1-Hour Resistance: 4055, Support: 4000 In the short term, the gold bull market faces the risk of cooling. However, medium- to long-term bulls do not need to panic. Future tariff inflation risks, the trend of central bank gold purchases, and the prolonged geopolitical economic uncertainties, along with the Fed's declining real interest rates, will continue to support gold's core value as a safe-haven asset. The market is at an inflection point; gold bulls need to patiently wait for clearer inflation data or the triggering of new safe-haven events before resuming the upward trend. The technical picture is largely in line with recent analysis expectations. The continuous decline on the daily chart strengthens the short-term bearish outlook. After the price broke below the Bollinger Middle Band support, the bears are bound to extend the decline. The 4000 level remains crucial in the short term. A decisive break below this level would warrant a short-term sell signal, targeting 3930 or even a drop below 3900 to around 3880. Conversely, if the price rebounds and recovers 4100 in the short term, a buy signal is also warranted, potentially leading to a return to the 4220/4250 area. We need to pay close attention to the possibility of a December rate cut exceeding 60%, as this could trigger a sharp rebound in gold prices. Looking at the 1-hour chart, after the European session opened, gold's rebound was met with resistance near the middle Bollinger Band at 4043. It is currently in a downward pressure phase. Watch for resistance at the lower edge of the triangle consolidation range mentioned in yesterday's analysis, around 4050/4055. Trading Strategy: BUY: 4000~3996 SELL: 4050~4055 More Analysis →The bearish strategy at 4050 yielded a profit of 70 pips. You can close out some of the profits. Set protection
ActuaryJ
تحلیل طلا (XAUUSD) 17 نوامبر: استراتژی خرید و فروش در سطوح کلیدی 4030 و 4250
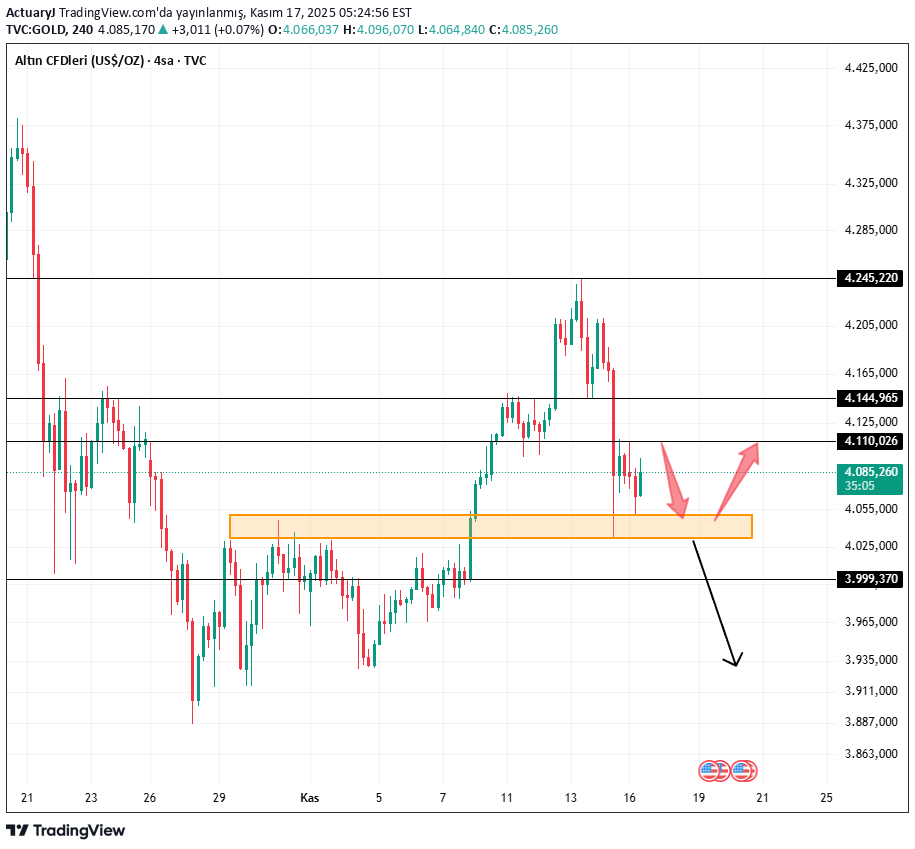
Altın Teknik Analizi: Günlük Direnç: 4250, Destek: 4000 4 Saatlik Direnç: 4145, Destek: 4030 1 Saatlik Direnç: 4110, Destek: 4050 Teknik tablo, son analiz beklentileriyle büyük ölçüde uyumlu. Haftalık grafik, bir yükselişin ardından geri çekilme gösteriyor ve bu da kısa vadeli yükselişi biraz zorlaştırıyor. Günlük mum formasyonunun "yuvarlak dip" desteği sağlam kalıyor ve Bollinger Bantları daralıyor. Tarihsel olarak, teknik bir düzeltmenin ardından daha fazla düşüş riski nispeten yüksek. Son makalelerimi takip edenler, 4030 seviyesinin önemli olduğunu biliyor. Yatırımcıların 4030 civarında dikkatli olması gerekiyor; Bu seviyenin altına doğru bir kırılma, 3930'a doğru kısa vadeli bir harekete yol açabilir. Fiyat kısa vadede toparlanıp 4130/4160 seviyelerini toparlarsa, 4220/4250 bölgesi potansiyel bir direnç seviyesi olarak kabul edilerek yükseliş eğilimi görülebilir. 1 saatlik grafiğe göre, altın şu anda boğalar ve ayılar arasında kısa vadeli bir çekişme içinde ve genel piyasa duyarlılığı zayıf seyrediyor. MACD/KDJ göstergelerinden gelecek destek momentumunu takip edin. NY Market İşlem Stratejisi: ALIŞ: 4050 yakın ALIŞ: 4040 yakın SAT: 4106~4110 Daha Fazla Analiz →
ActuaryJ
تحلیل طلا (XAUUSD) امروز: استراتژی خرید و فروش دقیق برای ۱۷ نوامبر
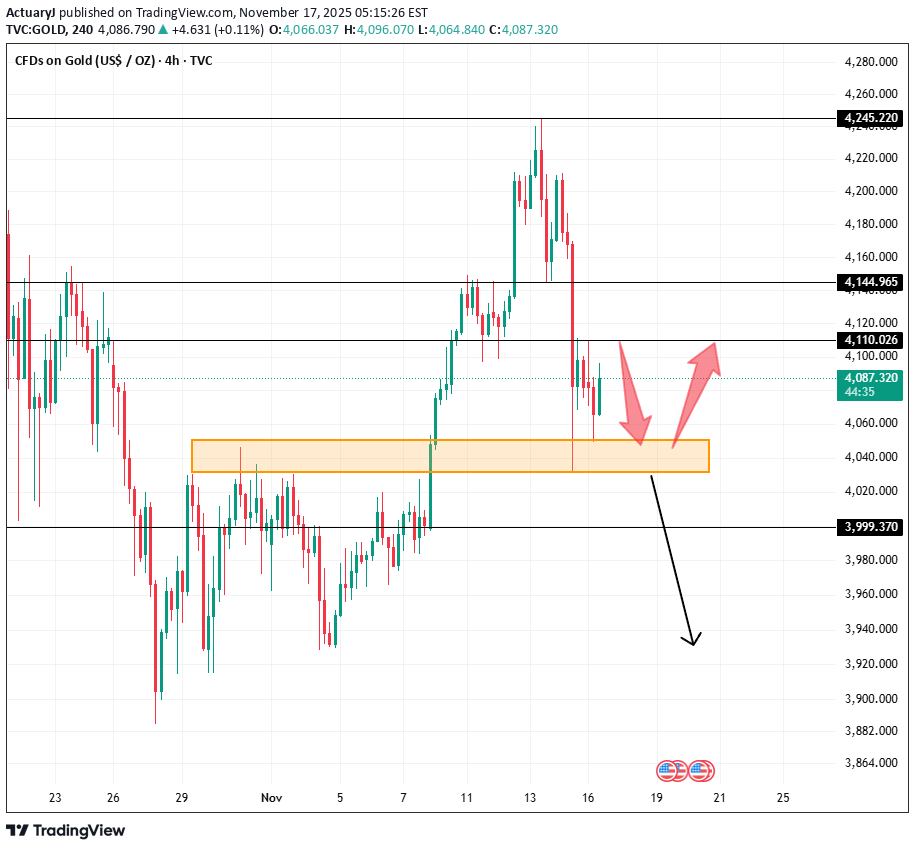
Gold Technical Analysis: Daily Resistance: 4250, Support: 4000 4-Hour Resistance: 4145, Support: 4030 1-Hour Resistance: 4110, Support: 4050 The technical picture is largely in line with recent analysis expectations. The weekly chart shows a pullback after a rally, making short-term bullishness somewhat difficult. The daily candlestick pattern's "rounded bottom" support remains intact, and the Bollinger Bands are narrowing. Historically, the risk of a further decline after a technical correction remains relatively high. Those who have been following my recent articles know the important level of 4030. Investors need to be cautious around 4030; a break below this level could lead to a short-term move towards 3930. If the price rebounds and recovers 4130/4160 in the short term, a bullish outlook is warranted, with the 4220/4250 area as a potential resistance level. Based on the 1-hour chart, gold is currently in a short-term tug-of-war between bulls and bears, with overall market sentiment remaining weak. Watch for support momentum from the MACD/KDJ indicators. NY Market Trading Strategy: BUY: 4050 near BUY: 4040 near SELL: 4106~4110 More Analysis →I hope so. Wish us luck.
ActuaryJ
تحلیل طلا (XAUUSD) امروز: استراتژی خرید در ریزش یا انتظار برای سقوط زیر ۴۰۸۰؟
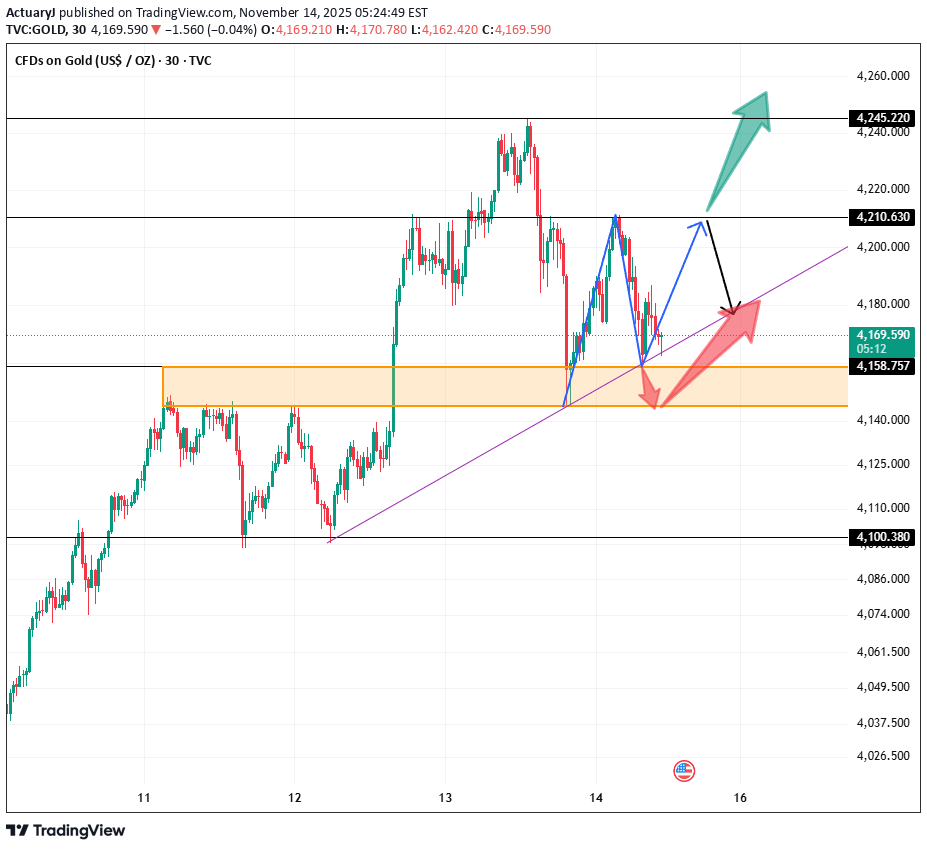
Gold Technical Analysis: Daily Resistance: 4275, Support: 4050 4-Hour Resistance: 4245, Support: 4145 1-Hour Resistance: 4210, Support: 4158 Technically, the monthly/weekly charts remain bullish; the daily chart shows a "rounding bottom" pattern, but attention should be paid to the Bollinger Bands' downward pressure around 4190. Historically, the risk of a technical correction and subsequent decline has increased. As those who have read my recent analyses know, I have consistently emphasized the key level of 4080/85; investors should remain vigilant at this level, while also monitoring the trend continuation after an upward breakout from 4290/4300. If the price breaks below 4080, short positions can be initiated with a target of 4000. Friday's gold market requires extreme caution! Looking at the 1-hour chart, the moving averages are alternately declining and under pressure, the Bollinger Bands are narrowing, and the MACD/KDJ indicators are crossing downwards, increasing the risk of a short-term technical pullback. Today, Friday, market trading risk is increased, and the short-term market continuity remains to be seen. The key support level to watch in the European and American sessions is around 4145. Today's trading strategy is to follow the larger timeframe trend and continue buying on dips, but attention should be paid to the resistance level at 4210 as a potential selling opportunity. Trading Strategy: BUY: 4170near BUY: 4145near BUY: 4130near SELL: 4210~4218 More Analysis →Gold prices rebounded after a sharp drop, starting to rise from around 4035.
ActuaryJ
تحلیل طلا (XAUUSD) امروز: استراتژی خرید در ریزشها یا انتظار برای جهش بزرگ؟
Altın Teknik Analizi: Günlük Direnç: 4275, Destek: 4050 4 Saatlik Direnç: 4240, Destek: 4155 1 Saatlik Direnç: 4240, Destek: 4210 Teknik olarak, aylık ve haftalık grafikler hala yükseliş trendine işaret ediyor. Günlük grafik oldukça standart ve kademeli olarak tamamlanan bir "yuvarlak dip" formasyonu gösteriyor. Mevcut mum formasyonu, daha önceki bir destek/direnç seviyesi olan 4262-4275 civarında önemli bir direnç gösteriyor. Tarihsel olarak, aşağı yönlü bir düzeltme muhtemel. Perşembe ve Cuma günleri dikkatli olmalı, 4160/4155 destek bölgesine odaklanmalı ve ayrıca 4300 seviyesinin üzerine doğru bir kırılmanın ardından trendin devamını izlemeliyiz. Fiyat 4080 seviyesinin altına düşerse, 4000 hedefine ulaşılabilir. Altın için yakın vadedeki ana strateji, yükseliş trendini sürdürmek! 1 saatlik grafiğe bakıldığında, hareketli ortalamalar yukarı doğru ayrışıyor ve bu da yukarı yönlü bir destek olduğunu gösteriyor. Bollinger Bantlarının yukarı doğru daraldığını ve MACD/KDJ göstergelerinin yukarı doğru hizalandığını unutmayın. Bugün, yani Perşembe günü, düşüş piyasası riski artıyor ve kısa vadeli piyasa sürekliliği henüz belli değil. Avrupa ve Amerika seanslarında, fiyatın 4204 destek seviyesi civarında istikrar kazanıp kazanamayacağına dikkat edin. İlk strateji, nispeten riskli olan mevcut fiyattan alım yapmaktır. Daha güvenli bir strateji ise, piyasaya girmek için 4204/4200 civarına geri çekilmeleri beklemektir. Temkinli bir strateji: ALIŞ: 4204~4200 Diğer stratejiler
ActuaryJ
تحلیل طلا (XAUUSD): استراتژی معاملاتی حرفهای برای امروز - خرید در چه قیمتی امن است؟
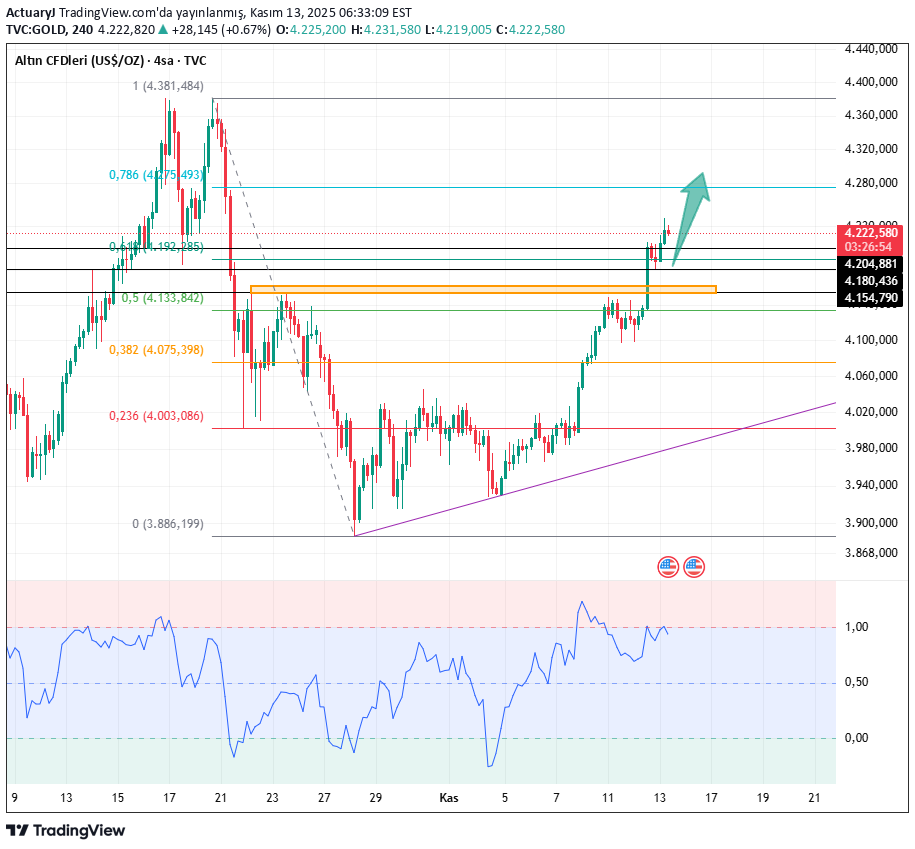
Gold Technical Analysis: Daily Resistance: 4275, Support: 4050 4-Hour Resistance: 4240, Support: 4155 1-Hour Resistance: 4240, Support: 4210 Technically, the monthly and weekly charts still indicate an upward trend. The daily chart shows a very standard and gradually completing "rounded bottom" pattern. The current candlestick pattern presents key resistance around 4262-4275, a previous support/resistance level. Historically, a downward correction is likely. We need to be cautious on Thursday and Friday, focusing on the support zone of 4160/4155, and also monitoring the continuation of the trend after a breakout above 4300. If the price falls back below 4080, a target of 4000 could be reached. The main strategy for gold in the near term is to continue the upward trend! Looking at the 1-hour chart, the moving averages are diverging upwards, providing support. Note the Bollinger Bands are narrowing upwards, and the MACD/KDJ indicators are providing upward momentum. Today, Thursday, the risk of a bearish market is increasing, and the short-term market continuity remains to be seen. During the European and American sessions, pay attention to whether the price can stabilize around the 4204 support level. The first strategy is to buy at the current price, which is relatively risky. A safer strategy is to look for pullbacks to around 4204/4200 to enter the market. A cautious strategy: BUY: 4204~4200Where will gold go? Does anyone else think it will reach the 4260-4275 range?
ActuaryJ
تحلیل طلا (XAUUSD): استراتژی معاملاتی امروز و سطوح مهم خرید و فروش
Gold Technical Analysis: Daily Resistance: 4192, Support: 4030 4-Hour Resistance: 4155, Support: 4080 1-Hour Resistance: 4150, Support: 4100 From a technical perspective, the monthly/weekly charts clearly indicate a short-term upward trend. The "rounded bottom" pattern on the daily candlestick chart is essentially confirmed. The previous pullback highs of 4155/4162 are key resistance levels in the short term, potentially leading to a downward technical correction. Short-term caution is advised regarding a test of the previous support/resistance level in the 4185-4180 area. Pay attention to the 4100/4080 support levels; if these levels hold, continue to buy on dips, while also monitoring the continuation of the upward trend after a breakout. Looking at the 1-hour chart, the moving averages are converging, and the candlestick pattern forms a range-bound trading pattern between 4100 and 4150. The MACD/KDJ indicators provide upward momentum, but the short-term market continuity remains to be seen. During the European and American sessions, watch for potential resistance and a pullback around 4145/4150. Trading Strategy: BUY: 4105~4100 SELL: 4145~4150 More Analysis →
Disclaimer
Any content and materials included in Sahmeto's website and official communication channels are a compilation of personal opinions and analyses and are not binding. They do not constitute any recommendation for buying, selling, entering or exiting the stock market and cryptocurrency market. Also, all news and analyses included in the website and channels are merely republished information from official and unofficial domestic and foreign sources, and it is obvious that users of the said content are responsible for following up and ensuring the authenticity and accuracy of the materials. Therefore, while disclaiming responsibility, it is declared that the responsibility for any decision-making, action, and potential profit and loss in the capital market and cryptocurrency market lies with the trader.