Technical analysis by ActuaryJ about Symbol PAXG on 11/12/2025

تحلیل طلا (XAUUSD): استراتژی معاملاتی امروز و سطوح مهم خرید و فروش
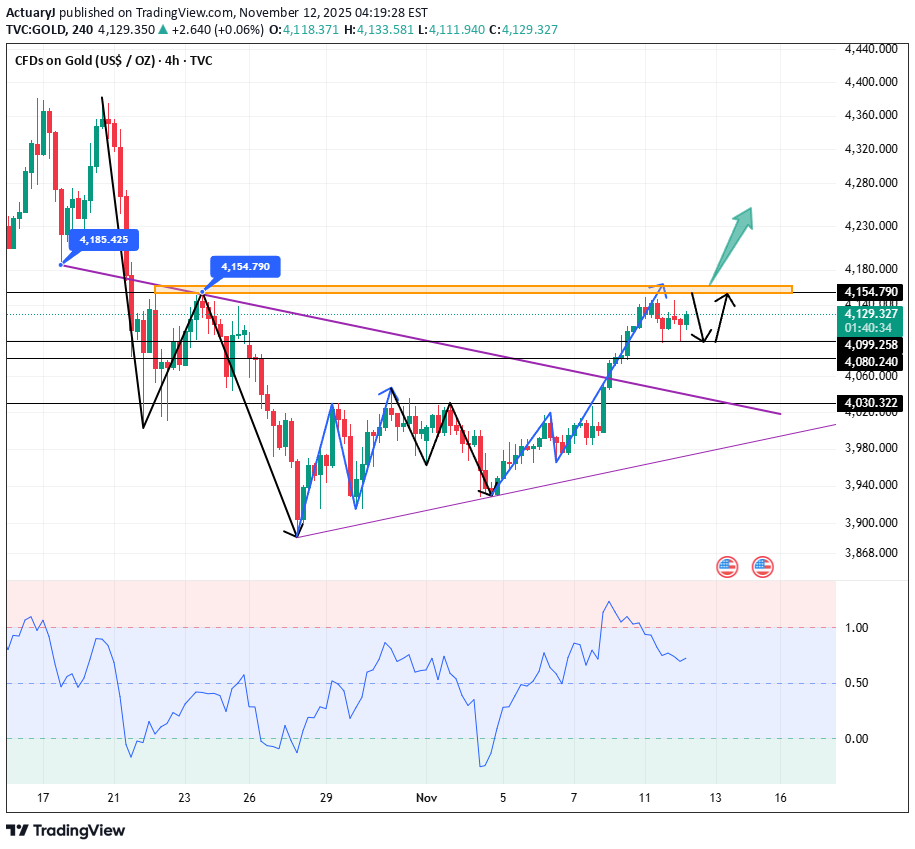
Gold Technical Analysis: Daily Resistance: 4192, Support: 4030 4-Hour Resistance: 4155, Support: 4080 1-Hour Resistance: 4150, Support: 4100 From a technical perspective, the monthly/weekly charts clearly indicate a short-term upward trend. The "rounded bottom" pattern on the daily candlestick chart is essentially confirmed. The previous pullback highs of 4155/4162 are key resistance levels in the short term, potentially leading to a downward technical correction. Short-term caution is advised regarding a test of the previous support/resistance level in the 4185-4180 area. Pay attention to the 4100/4080 support levels; if these levels hold, continue to buy on dips, while also monitoring the continuation of the upward trend after a breakout. Looking at the 1-hour chart, the moving averages are converging, and the candlestick pattern forms a range-bound trading pattern between 4100 and 4150. The MACD/KDJ indicators provide upward momentum, but the short-term market continuity remains to be seen. During the European and American sessions, watch for potential resistance and a pullback around 4145/4150. Trading Strategy: BUY: 4105~4100 SELL: 4145~4150 More Analysis →