
ATGFX
@t_ATGFX
What symbols does the trader recommend buying?
Purchase History
پیام های تریدر
Filter
Signal Type

ATGFX
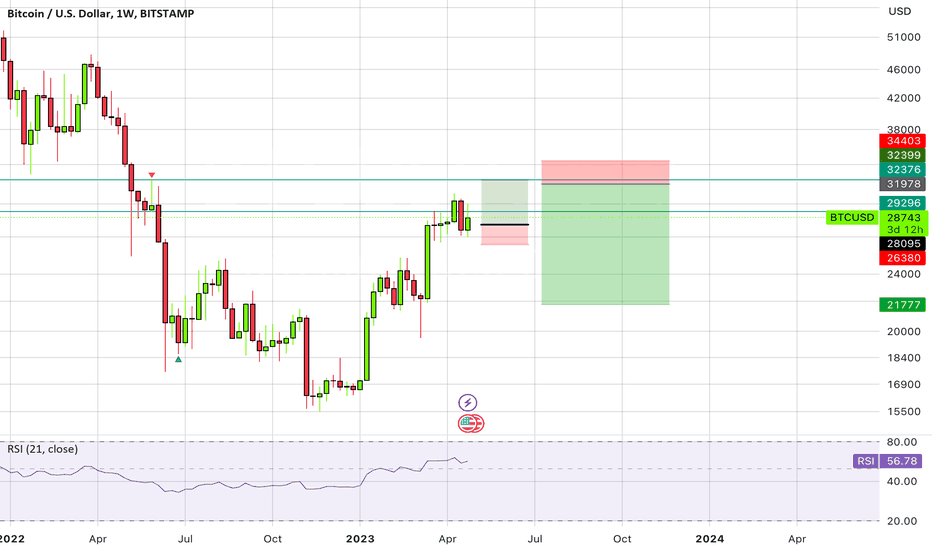
btcusd down side short term hold longs in meantime and layer in DCA

ATGFX
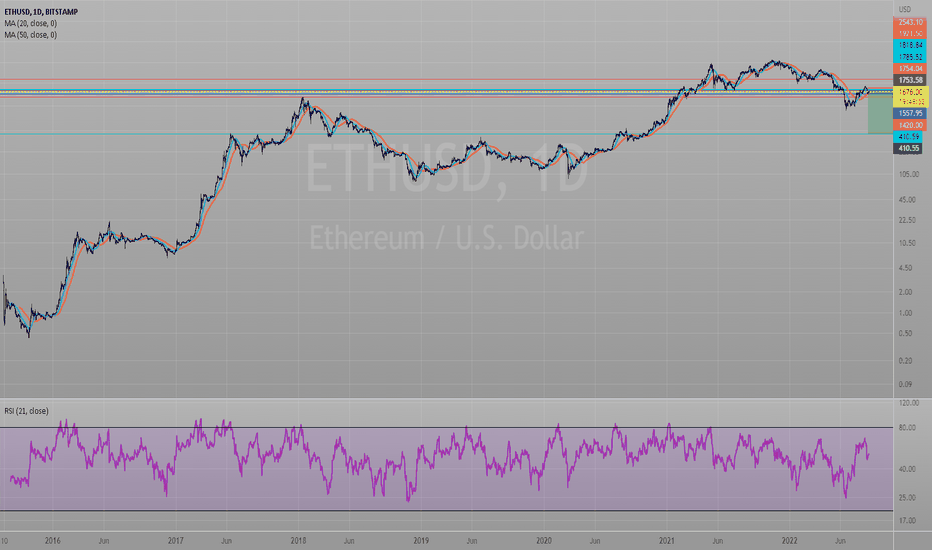
ETHUSD SHORT provided we find resistance and indication of bearish PA and level marked, i expect a possible fall of around 50 %, or in extension even as low as $400

ATGFX
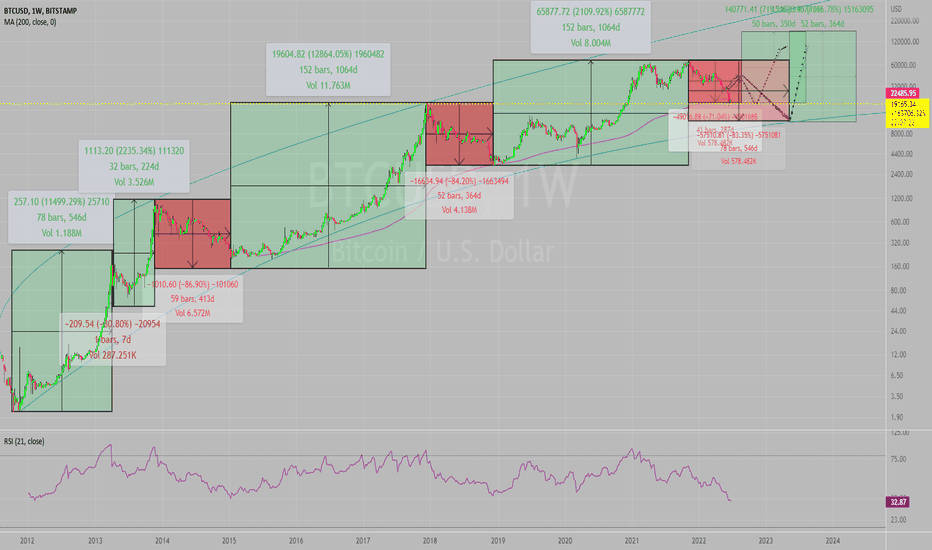
BTCUSD possible repeat of pattern shown by date/price range drawings, and the price changes made previously from swing lows to swing highs.

ATGFX
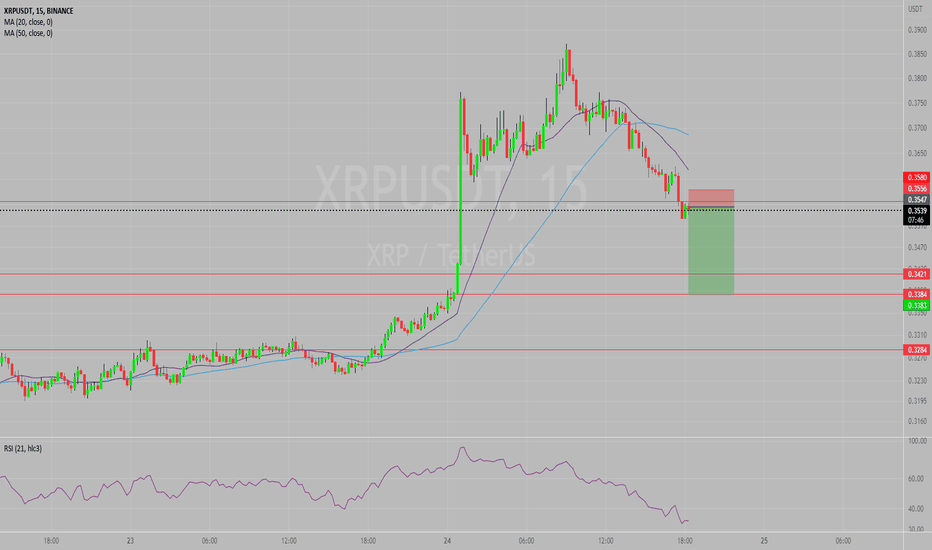
Short term short position following bearish strength bounce from resistance down to support level, expecting the support level shown as TP to hold as support so risking little on this trade given that we are currently in a support area and market could change from bear strength to continuing its upward bounce from D1 support.

ATGFX
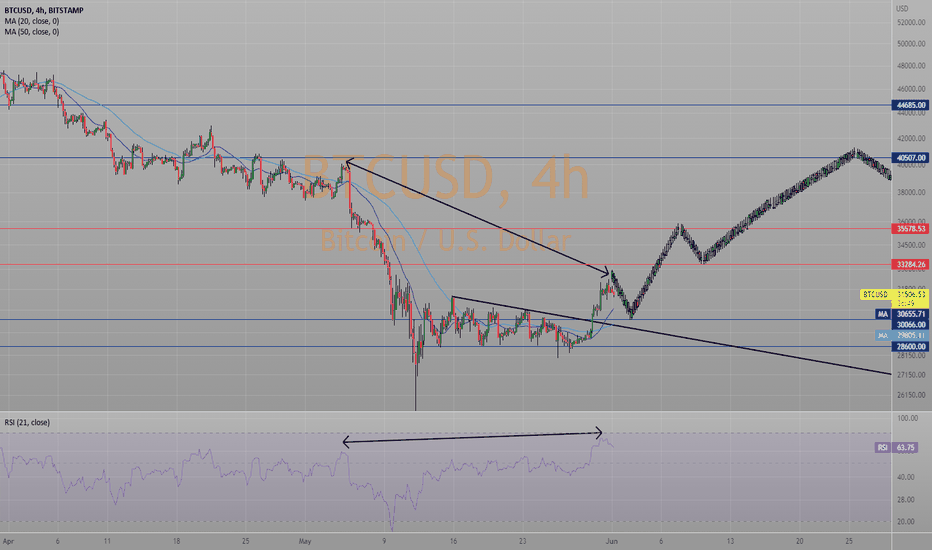
Originally I had intended to post this analysis with the 4H timeframe and made a couple other errors in my previous post, this post now shows the charts as i'd originally intended. BTCUSD showing hidden divergence in the bearish micro-trend *(1), formed on the 4H timeframe within Bitcoins' recent pullback from recent highs. This (hidden) divergence pattern is indicating a possible swing move to lower levels (expecting 30k area if this occurs) as a continuation of the bearish micro-trend within BTC's overarching bullish trend . Should we see a downward swing come about in the near future, i expect that we will find support at 30k area, along with the possible formation of a bullish hidden divergence pattern forming on the 1H timeframe (outlined below). the combination of support being found and the recent move upward from recent lows will provide the egregious justification for overzealous bulls to load up on longs that just arent ready yet, after a short move to the upside where these bulls may be extremely confident and satisfied i expect a continuation of the downward move we've been seeing. See D1 chart below Upon reaching 40-45k resistance; provided things climb steadily -sans any sudden bursts of volatility- to these levels, I expect, rather shockingly, yet another divergence pattern. This time on a longer and much more reliable timeframe, the D1, will foretell a fall to lower levels, possibly back to recent lows. I don't see the Bulls being as lucky as a fall merely to recent lows however, I seriously believe that we will not only reach 28k, but will see as low as 21, possibly stretching to 19k USD per BTC . These ideas i have are tentative, i see them as likely to occur, not necessarily strong enough to attempt to trade each swing, but certainly strong enough for me to keep in mind and spend this much time (the most detail i've put into a post in years) posting about as warning for anyone willing to listen. Good luck to all *(1) Micro-trend: I call this bearish swing from recent ATH's a "Micro-trend" because although the overall trend for BTCUSD is a bullish one, on lower timeframes we can isolate this pattern of lower lows and lower highs and treat is as a trend in and of itself, however we must bear in mind that it is the smaller of the trends, and whilst it can be treated as its own entity, we must respect the fact that it is part of the matrix that forms the entire bullish trend . (2) I say uptrend here as an adjective somewhat reservedly, I use it because its the most relatable term for people and while technically there is an uptrend there -See *(1) above- this is only technically accurate if we take it down to a much lower timeframe like 5 or 15 minutes. Here are some chart snapshots of the divergence patterns I'm seeing on various timeframes, as time goes on I will update this forecast with new snapshots of the charts on each of these timeframes to compare before and after. 4H Hidden divergence, indicating a continuation of the bear move to lower levels. 1H chart, expecting a hidden divergence pattern to form indicating an end to any downward move that may occur, bringing about a swing back upwards to higher levels, this would be in the "uptrend" *(2) formed since the breakout of the downward triangle shown D1 Chart, Hidden divergence formation looking likely (The same pattern as shown on the 4H chart above), provided we don't see a sudden spike in volatility and price, if things stay stable and continue climbing as they are I expect that a hidden divergence pattern will form as price approaches the 40-45k area,1H Chart divergence update, after the fall to 30k area, divergence pattern on the 1h chart has formed like predicted, whether or not btcusd finds support here and rises to 40-45 k is another matter, looking for bullish price action on 1h and 4 hr charts to signal an upward swing as possible,

ATGFX
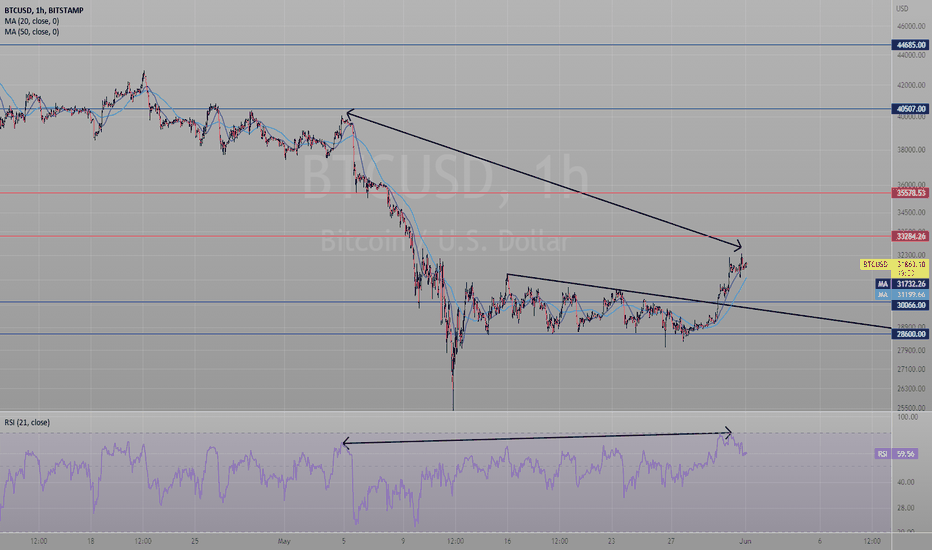
BTCUSD showing hidden divergence in the bearish micro-trend *(1), formed on the 4H timeframe within Bitcoins' recent pullback from recent highs. This (hidden) divergence pattern is indicating a possible swing move to lower levels (expecting 30k area if this occurs) as a continuation of the bearish micro-trend within BTC's overarching bullish trend. Should we see a downward swing come about in the near future, i expect that we will find support at 30k area, along with the possible formation of a bullish hidden divergence pattern forming on the 1H timeframe (outlined below). the combination of support being found and the recent move upward from recent lows will provide the egregious justification for overzealous bulls to load up on longs that just arent ready yet, after a short move to the upside where these bulls may be extremely confident and satisfied i expect a continuation of the downward move we've been seeing. See D1 chart below Upon reaching 40-45k resistance; provided things climb steadily -sans any sudden bursts of volatility- to these levels, I expect, rather shockingly, yet another divergence pattern. This time on a longer and much more reliable timeframe, the D1, will foretell a fall to lower levels, possibly back to recent lows. I don't see the Bulls being as lucky as a fall merely to recent lows however, I seriously believe that we will not only reach 28k, but will see as low as 21, possibly stretching to 19k USD per BTC. These ideas i have are tentative, i see them as likely to occur, not necessarily strong enough to attempt to trade each swing, but certainly strong enough for me to keep in mind and spend this much time (the most detail i've put into a post in years) posting about as warning for anyone willing to listen. Good luck to all *(1) Micro-trend: I call this bearish swing from recent ATH's a "Micro-trend" because although the overall trend for BTCUSD is a bullish one, on lower timeframes we can isolate this pattern of lower lows and lower highs and treat is as a trend in and of itself, however we must bear in mind that it is the smaller of the trends, and whilst it can be treated as its own entity, we must respect the fact that it is part of the matrix that forms the entire bullish trend. (2) I say uptrend here as an adjective somewhat reservedly, I use it because its the most relatable term for people and while technically there is an uptrend there -See *(1) above- this is only technically accurate if we take it down to a much lower timeframe like 5 or 15 minutes. Here are some chart snapshots of the divergence patterns I'm seeing on various timeframes, as time goes on I will update this forecast with new snapshots of the charts on each of these timeframes to compare before and after. 4H Hidden divergence, indicating a continuation of the bear move to lower levels. 1H chart, expecting a hidden divergence pattern to form indicating an end to any downward move that may occur, bringing about a swing back upwards to higher levels, this would be in the "uptrend" *(2) formed since the breakout of the downward triangle shown D1 Chart, Hidden divergence formation looking likely (The same pattern as shown on the 4H chart above), provided we don't see a sudden spike in volatility and price, if things stay stable and continue climbing as they are I expect that a hidden divergence pattern will form as price approaches the 40-45k area,Update to the post, check the next post "BTCUSD DIVERGENCE- Correction to previous trade" to see this idea as I'd originally written it, showing the correct charts in the right places & with missing information.1H Chart divergence update, after the fall to 30k area, divergence pattern on the 1h chart has formed like predicted, whether or not btcusd finds support here and rises to 40-45 k is another matter, looking for bullish price action on 1h and 4 hr charts to signal an upward swing as possible,

ATGFX
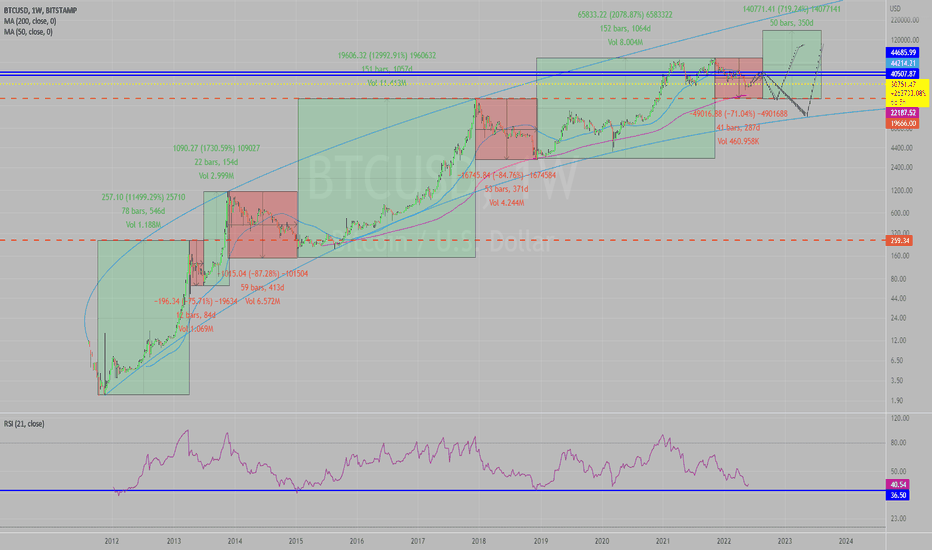
Possible bull trap, expecting short rise, then a fall to 19=22k area, possibly even as low as 15K if things get really hairy before continuing up to new ATH of 160k area.

ATGFX
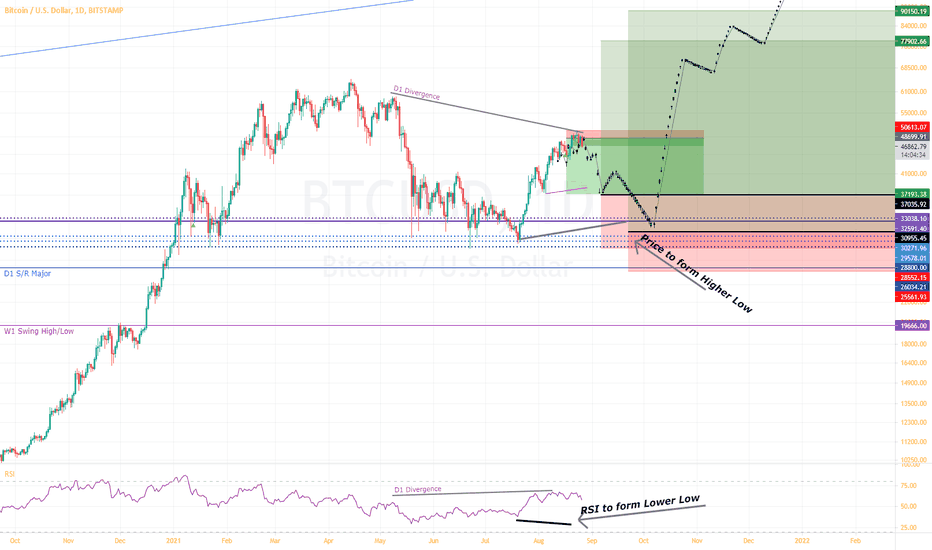
BTCUSD Looking short as per previous charts to levels, 37/36k USD to as low as 30,000 USD before continuing long. D1 Divergence occuring, looking to continue short on a swing trade down to levels shown, this is an area i consider to be a good buy opportunity provided we continue upward into previous ATH or possibly new ATH, i'm unconvinced of this bearish indication and believe it to be a fakeout. i see us continuing upward to previous predicted highs of 78,000USD - 92,000 USD per Bitcoin. D1 divergence is hidden divergence, however this hidden divergence is occuring in a downtrend which itself has formed within the overarching uptrend of bitcoins price action, this divergence is good in my eyes for a swing trade from resistance down to support where i've shown that i see the RSI and Price diverging once again, hidden divergence, however this time it will be hidden divergence forming in the overall uptrend on the W1 time frame, with a confluence of 4H, D1 & W1 divergence and support being found by bitcoin i consider this to be a strong indication that price will continue to increase, this however remains to be seen and will need to be looked at to confirm this trade long when the time is right and when/if price reaches the levels i've shown to be the target of this short trade. Good Luck all, please feel free to chime in if you agree or disagree, but if you do please elaborate on your opinion, otherwise it isn't beneficial to anyone.

ATGFX
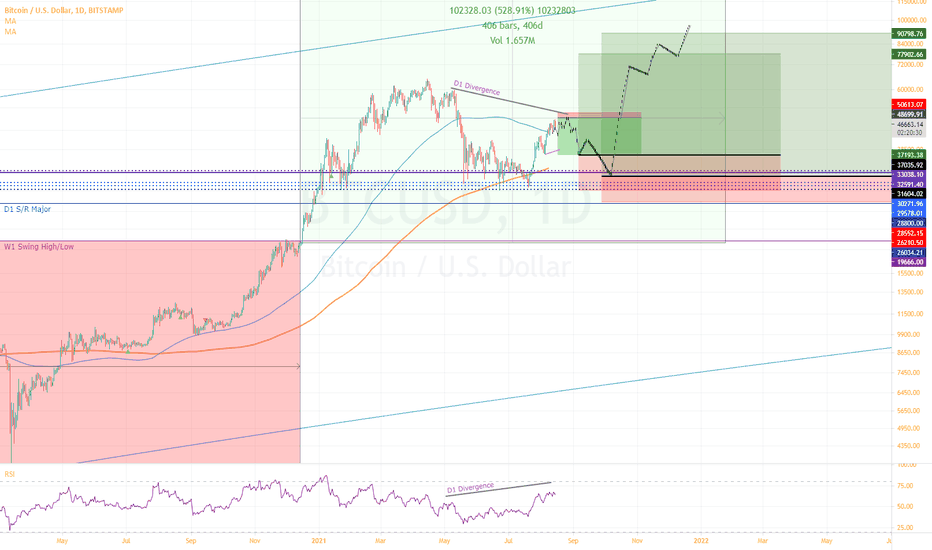
Longer term outlook projection of new ATH of $78,000-$90,000 USD,

ATGFX
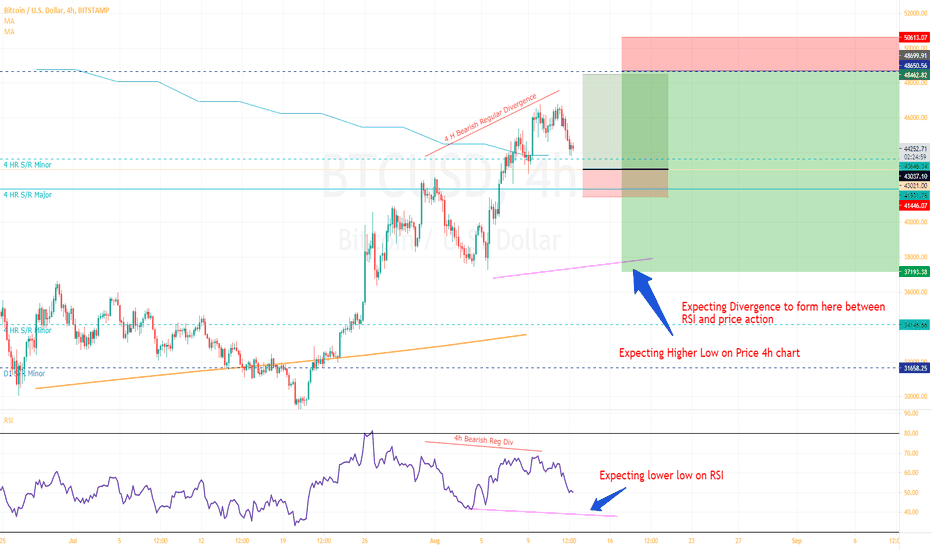
RSI divergence indicating swing upward on 1h charts, expecting a move upward toward previous swing high, breaking over indicating bullish move pulling in bulls before a swing lower from resistance, upon which lower low will be created and 4h chart will begin diverging on price and RSI where support is found before a continuation upward to over 48,0001H time frame showing divergence indicating short move back up to previous high, 4 hr divergence overshadowing indicating continued move downward,
Disclaimer
Any content and materials included in Sahmeto's website and official communication channels are a compilation of personal opinions and analyses and are not binding. They do not constitute any recommendation for buying, selling, entering or exiting the stock market and cryptocurrency market. Also, all news and analyses included in the website and channels are merely republished information from official and unofficial domestic and foreign sources, and it is obvious that users of the said content are responsible for following up and ensuring the authenticity and accuracy of the materials. Therefore, while disclaiming responsibility, it is declared that the responsibility for any decision-making, action, and potential profit and loss in the capital market and cryptocurrency market lies with the trader.