
ALLEYPROFESSIONALS
@t_ALLEYPROFESSIONALS

What symbols does the trader recommend buying?
Purchase History
پیام های تریدر
Filter
ALLEYPROFESSIONALS
XAUUSD Sell Setup | Smart Money Rejection at Key Resistance

Gold is currently respecting a strong resistance zone near 4350, where price has failed multiple times. Market is forming lower highs, signaling weak bullish momentum and a potential bearish continuation. 📌 Key Observations: Price rejected from major supply zone Structure showing range → breakdown possibility Supertrend acting as dynamic resistance Liquidity sweep already completed above highs 📉 Trade Idea: Sell below resistance Stop Loss: Above 4350 (invalidation zone) Take Profit: 4290 & below (next demand zone) ⚠️ Market may consolidate before a sharp move — patience is key. Always manage risk and avoid emotional trading. 🔔 Follow for Real-Time Gold Analysis, 💬 Comment your bias (BUY / SELL), ❤️ Like & Share if this helped your trading. #XAUUSD #GoldTrading #SmartMoney #ForexAnalysis #PriceAction #TradingView #GoldSell #SupplyAndDemand #RiskManagement
ALLEYPROFESSIONALS
هشدار طلای انفجاری: روند صعودی جدید با هدف رسیدن به قیمت ۴۱۳۹!

📊 XAUUSD Technical Analysis (2H Chart) Gold is showing strong bullish momentum, forming a clear uptrend channel after breaking the previous resistance zone. 🔹 Key Resistance: 4063–4067 If price breaks and sustains above this area, the upside move could accelerate quickly toward the next target zone between 4097–4139. 🔹 Support / Retracement Zone: 4017–3992 A short-term pullback is possible toward this region before continuation, maintaining bullish structure as long as price stays above 3990. 🔹 Trend Outlook: New bullish trend has begun — buyers remain in control. Watch for confirmation breakout above resistance for continuation. 🎯 Targets: TP1: 4097 TP2: 4139 🟢 Bias: Bullish ⚠️ Note: If price rejects 4067 strongly, short-term correction could occur before next leg up.As predicted, GOLD successfully reached our target zone 4097–4139! The breakout above 4067 confirmed the bullish move perfectly. Now watching for possible retracement around 4090–4070 before next trend setup.
ALLEYPROFESSIONALS
سیگنال فروش طلا فعال شد: منتظر ریزش بزرگ در XAUUSD باشید!
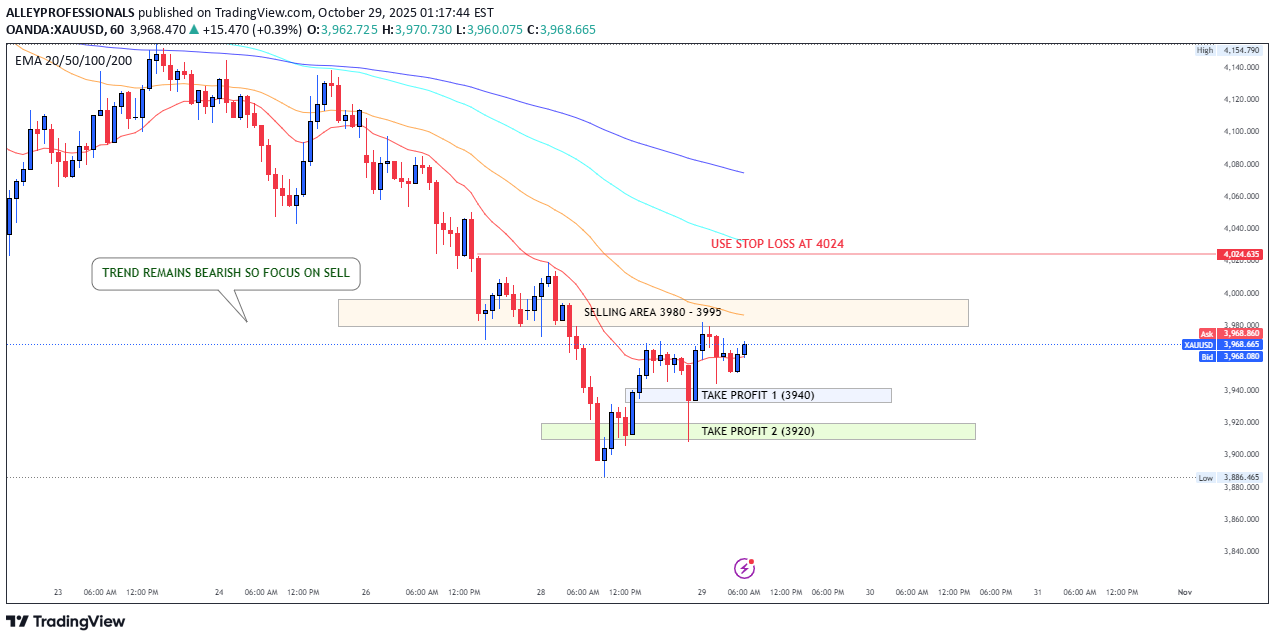
📉 XAUUSD Analysis (29 Oct 2025) – Trend Remains Bearish! Gold continues to follow a bearish structure, with price respecting lower highs and EMAs showing clear downside momentum. 🧭 🔹 Selling Area: 3980 – 3995 🔹 Stop Loss: 4024 (Above structure resistance) 🔹 Take Profit 1: 3940 🔹 Take Profit 2: 3920 💬 Analysis Insight: Price is currently retesting the supply zone (3980–3995). As long as price stays below this zone, sellers remain in control. Watch for bearish confirmations before entering short positions. 🧠 Trading Idea: Focus on Sell setups only until we get a clear breakout above 4024. Patience and precision can lead to clean entries with low risk and high reward! ⚠️ Note: Always manage risk smartly — market volatility can shift anytime! 💎 Follow for more daily gold setups, smart entries & risk-free trading plans! #XAUUSD #GoldAnalysis #PriceAction #ForexSignals #TechnicalAnalysis #BearishTrend #GoldSetup #TradingView #SmartTradingTarget hit Trade Closed
ALLEYPROFESSIONALS
طلا در آستانه انفجار بزرگ: منتظر این دو منطقه کلیدی باشید!

Gold is heating up once again! After a strong rally, price has formed a Double Top near the Resistance Zone while holding above a key Trendline Support. Now, the battle between buyers and sellers begins — and the next breakout could decide the next $100+ move! ⚔️ 📊 Chart Breakdown 🔺 Resistance Area: 4059 – 4095 → Double Top region 🔻 Support Zone: 3935 – 3965 → Bulls last defense 📈 Trend Line: Still intact — watch for a bounce confirmation ⚙️ EMA (20/50/100/200): Price testing short-term EMAs for direction 💬 “These both areas will decide further move — trade between the zones!” 💡 Trading Plan ✅ Buy Setup: Wait for bullish candle confirmation from 3935 – 3965 support ❌ Sell Setup: Look for bearish rejection around 4059 – 4095 resistance 🎯 Breakout above or below these zones could trigger a 3%+ move — stay alert! 🔥 Analyst Note Gold is consolidating after a strong impulse wave. The current structure shows range compression inside a bullish channel — meaning a powerful breakout is on the way. Smart traders are preparing their positions before the move happens. Are you ready? ⚡ 💬 Drop your view below — Bullish or Bearish? 👍 Like & 🔁 Share this idea
ALLEYPROFESSIONALS
نقطه عطف طلا: آیا خیز بزرگ بعدی در راه است؟ (تحلیل تکنیکال XAUUSD)

Gold is sitting right at a major resistance zone, and things are heating up! If bulls manage to break above this area, we might see gold fly to new highs — but if not, a pullback could be on the cards. Here’s what I’m watching 👇 🔸 Resistance: 3940–3960 — breakout = bullish continuation. 🔹 Support: 3810–3830 — break below = possible deeper drop. ⚙️ Short-Term Support: Area where price might bounce before another leg up. 📉 Possible Scenarios: 1. Price breaks out → Gold continues its bullish run 🚀 2. Price rejects → Possible drop back to support for a retest What’s your bias here — bullish or bearish on gold this week? 🤔 Drop your thoughts in the comments 👇 #XAUUSD #Gold #GoldForecast #PriceAction #TradingView #Forex #Commodities #TechnicalAnalysis #GoldPrice #DayTrading #SwingTrading
ALLEYPROFESSIONALS
XAUUSD(Gold) Bullish (READ THE CAPTION)

Hello dear friends check XAUUSD (Gold) signal here and share your ideas about it. According to my personal opinions Gold will Bullish now until the given target. Key Points Are Given Bellow . 🔑Key Points are Given Bellow. ✔️Resistance Zone 1/ 3870 ✔️Resistance Zone 2/ 3940 📊Support Zone. / 3750 📌Target level is / 3940 ✅ Stay Ahead in Market. 📌 Like ,Comment and follow for timely Updates.gold has breaks both resistances Almost given target hit .
ALLEYPROFESSIONALS
BTCUSD – 2H Chart (READ CAPTION)

📈Check Out BTCUSD (Bitcoin) Analysis And Share your Opinions about it. 📈 BTCUSD Will Bullish More Technical Analysis Indicates a Complete Bullish Trend Hopefully it will buy to My Given Targets. 🎯 Technical Target are $116,500 - 120,500 Support Zone 108,400 📌Let's Focus on The Chart And Share your Opinions about it, Boost + Comment on my Idea.btcusd reached at target point price breaks my given resistance now hit 125,800 .
ALLEYPROFESSIONALS
BITCOIN Pullback buy

📈Check Out BTCUSD (Bitcoin) Analysis And Share your Opinions about it. 📈 BTCUSD Will Bullish More Technical Analysis Indicates a Complete Bullish Trend Hopefully it will buy to My Given Targets. 🎯 Technical Target are $116,207 📌Let's Focus on The Chart And Share your Opinions about it, Boost + Comment on my Idea.
ALLEYPROFESSIONALS
GOLD (XAUUSD): Rise to All-Time High Confirmed

There is a high chance that Gold will continue rising next week, following a completion of a correctional movement on a 2H time frame with a confirmed bullish Change of Character CHoCH. Odds are high, that the price will rise to 3840 level, with a highly probable update of ATH. ❤️Please, support my work with like, thank you!❤️ Key Levels Pivot 3766 Resistance 3792 - 3810 - 3840 Support 3737
ALLEYPROFESSIONALS
XAUUSD (Gold) – 1H Chart Analysis (READ CAPTION)
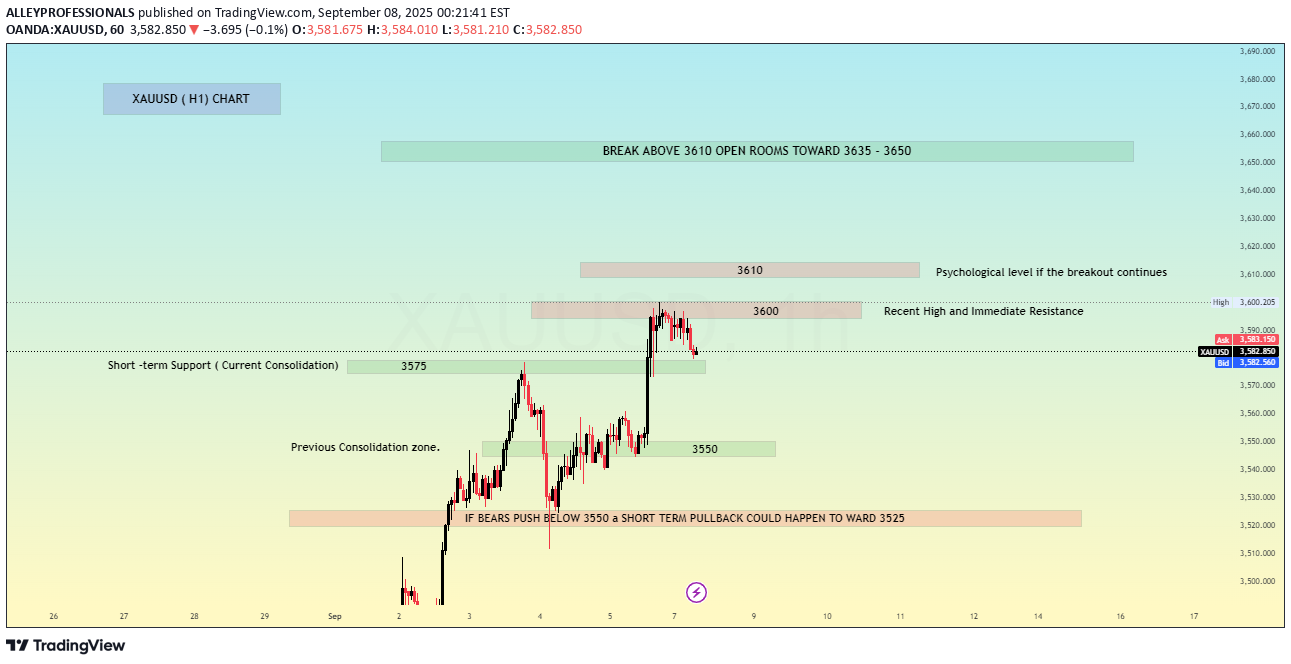
Gold (XAUUSD) is currently consolidating after a strong bullish move, testing recent highs near 3600 – 3610. 🔑 Key Levels: Immediate Resistance: 3600 – 3610 (recent high & psychological level) Upside Breakout: Break above 3610 opens room toward 3635 – 3650 Short-term Support: 3575 (current consolidation zone) Critical Support: 3550 (previous consolidation base) Deeper Pullback Zone: If bears push below 3550, price may retrace toward 3525 📈 Bullish Outlook: Sustained momentum above 3610 could fuel further upside targeting 3635 – 3650. This would confirm continuation of the bullish structure. 📉 Bearish Outlook: Failure to hold 3575 – 3550 support could trigger a pullback toward 3525. Break below 3525 may expose deeper downside levels. ⚖️ Summary: Bias: Bullish above 3575, cautious below 3550. Watch 3610 for breakout confirmation. Short-term consolidation likely before next big move. ✅ If you found this analysis useful, please support with a boost 👍 and share your thoughts in the comments 💬 – your feedback motivates me to post more setups!Breakout above 3610 confirmed ✅ Both upside targets 3635 & 3650 achieved 🎯 Current price trading around 3656 🔑 Next Key Levels: Support: 3610 (breakout zone now acting as support) Resistance: 3675 / 3700 (watching as next potential upside targets) ⚠️ As long as price holds above 3610, momentum favors the upside.
Disclaimer
Any content and materials included in Sahmeto's website and official communication channels are a compilation of personal opinions and analyses and are not binding. They do not constitute any recommendation for buying, selling, entering or exiting the stock market and cryptocurrency market. Also, all news and analyses included in the website and channels are merely republished information from official and unofficial domestic and foreign sources, and it is obvious that users of the said content are responsible for following up and ensuring the authenticity and accuracy of the materials. Therefore, while disclaiming responsibility, it is declared that the responsibility for any decision-making, action, and potential profit and loss in the capital market and cryptocurrency market lies with the trader.