
A-Yousef
@t_A-Yousef

What symbols does the trader recommend buying?
Purchase History
پیام های تریدر
Filter
A-Yousef
سیگنال صعودی قدرتمند GALA/USDT: آماده جهش ۵ درصدی باشید؟

GALA USDT Long we could be looking at a potential 5% rise ahead
A-Yousef
پیشبینی صعودی بزرگ: گالا (GALA/USDT) آماده جهش ۵۰ درصدی پس از تکمیل الگوی هارمونیک!

After the XABCD Harmonic pattern completed, we started to see the price pushing toward point E, which is located around 0.023. at the same time , the price reached the sell-side liquidity zone. now , the possibility of an upward move and a breakout above the EMA 200 is very likely - we could be looking at a potential 50% rise ahead
A-Yousef
پیشبینی سودآور: فرصت خرید بلندمدت GALA/USDT با نقاط ورود، خروج و حد ضرر مشخص!

GALA/USDT long Entry 1563 TP 1881 SL 1530 Do you own research
A-Yousef

• Price is still holding above the 0.618 Fibonacci zone. • Harmonic analysis shows a bullish pattern completion, with price now consolidating above the Navarro200 level. • Stoch RSI has reached oversold territory, signaling strong potential for reversal. • Summary: Probability of an upside move toward the 0.021 region has become highly reasonable. ⚠ If price breaks below 0.01420, this analysis will be invalidated. ⚠ Final note: The U.S. Federal Reserve speech today will be the key catalyst that decides the next major market direction. 📌 This is not financial advice.
A-Yousef

GALA/USDT - Bullish - To 0.019$ Holding above this support increases the chance of a bullish reversal. ⚠️ Break below 0.0148 would cancel the bullish scenario.
A-Yousef
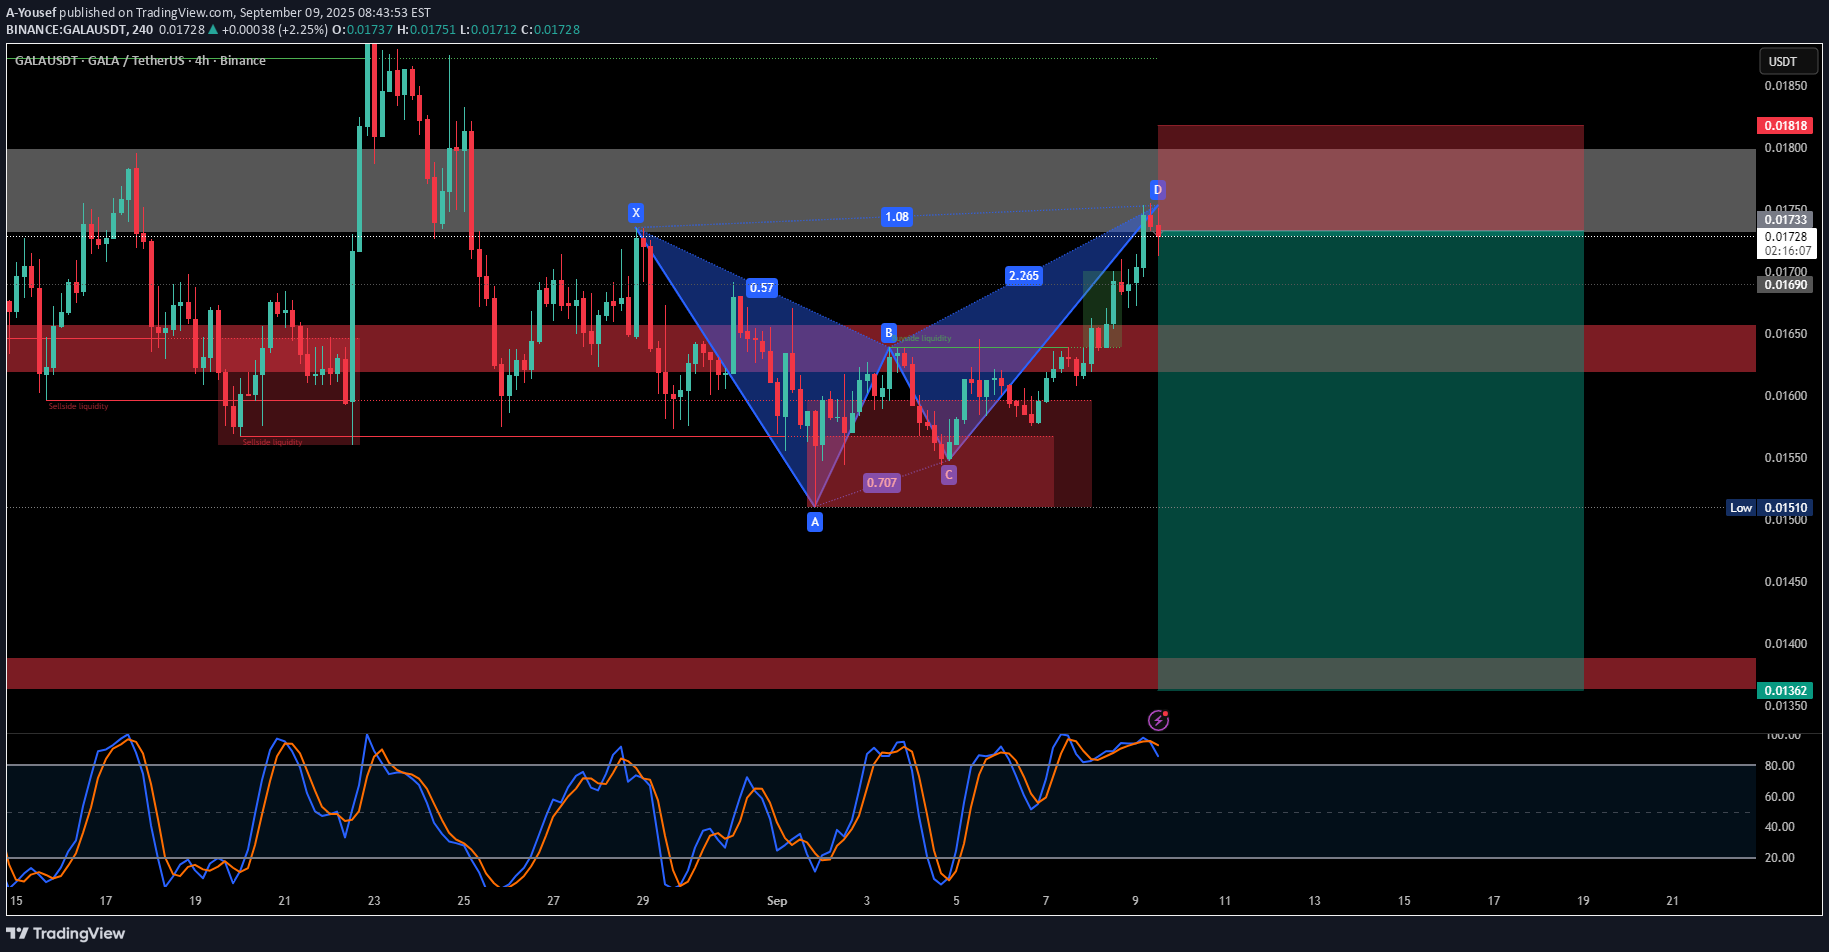
Bearish Harmonic Pattern Price completed a Bearish Gartley formation at point D (0.01733–0.01756 zone). This level aligns with a strong supply zone (gray area) where sellers historically stepped in. 📊 Technical Signals . Stochastic RSI: Currently in the overbought zone, showing potential weakness. . Liquidity Zones: Multiple sell-side liquidity pools exist below current price, increasing downside probability. . Rejection Wicks: Candles show early selling pressure at resistance. 🔑 Key Levels . Resistance (Short Entry Zone): 0.01733 – 0.01756 . First Support: 0.01550 . Deeper Support / Target: 0.01360 🎯 Trading Idea (Not Financial Advice) Bias: Bearish rejection likely from 0.0180 zone. Potential Targets: . TP1: 0.01550 . TP2: 0.01360 Stop Loss: Above 0.01818 ⚠ Disclaimer: This is market analysis for educational purposes only, not financial advice. Always manage your risk.
A-Yousef
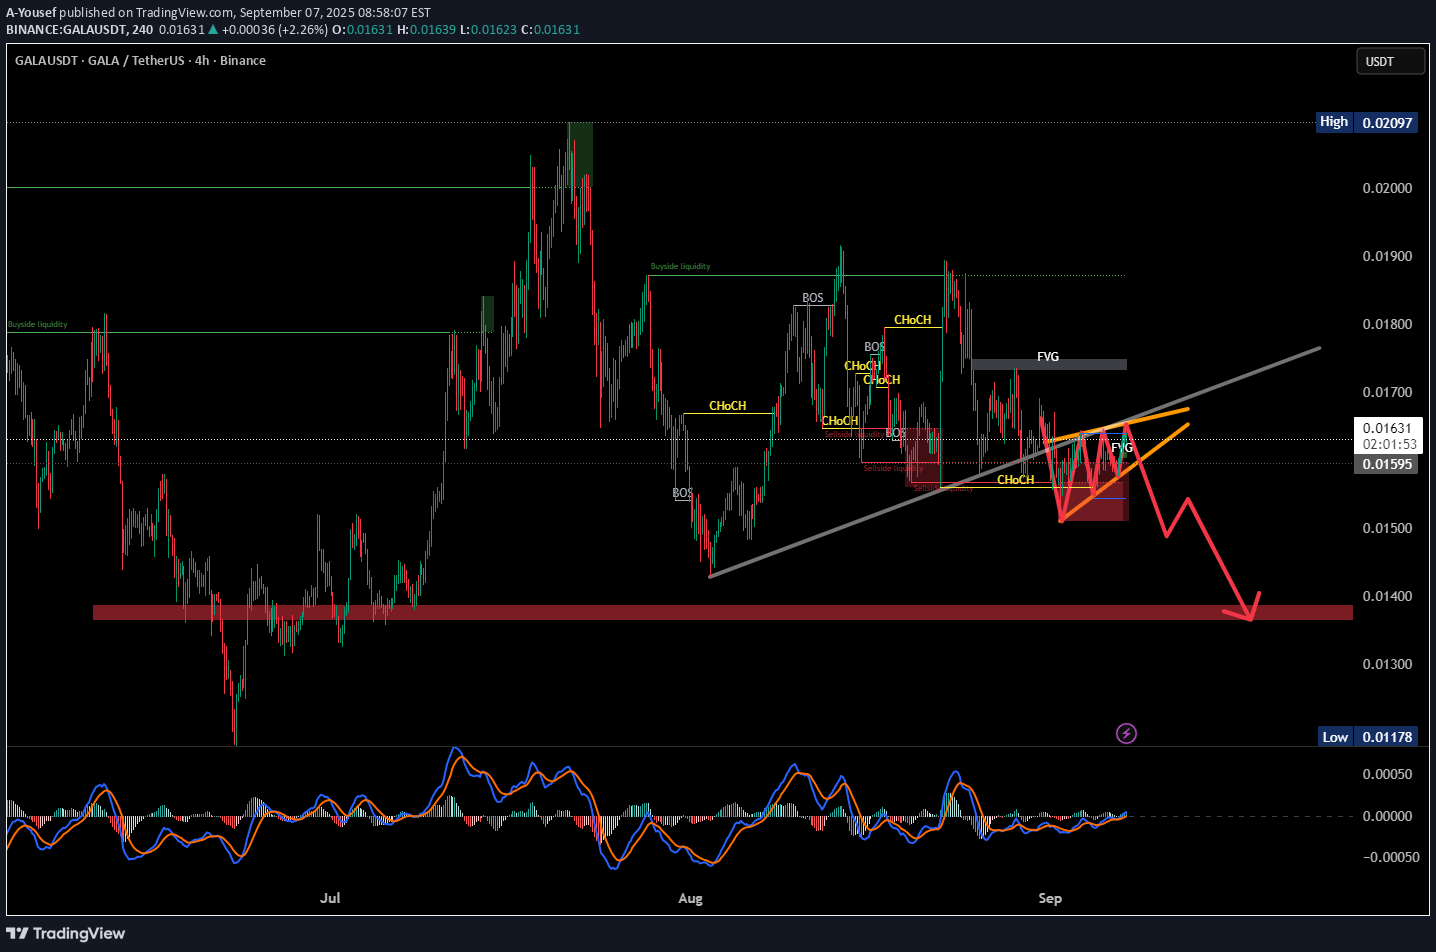
GALA/USDT – 4H Chart Analysis The price is forming a rising wedge pattern, typically a bearish continuation signal. The wedge is aligned with the ascending trendline, and a breakdown is highly probable. Liquidity below and the untested demand zone suggest a downward move. - Target: $0.01360 • This is a technical analysis perspective, not financial advice.
A-Yousef
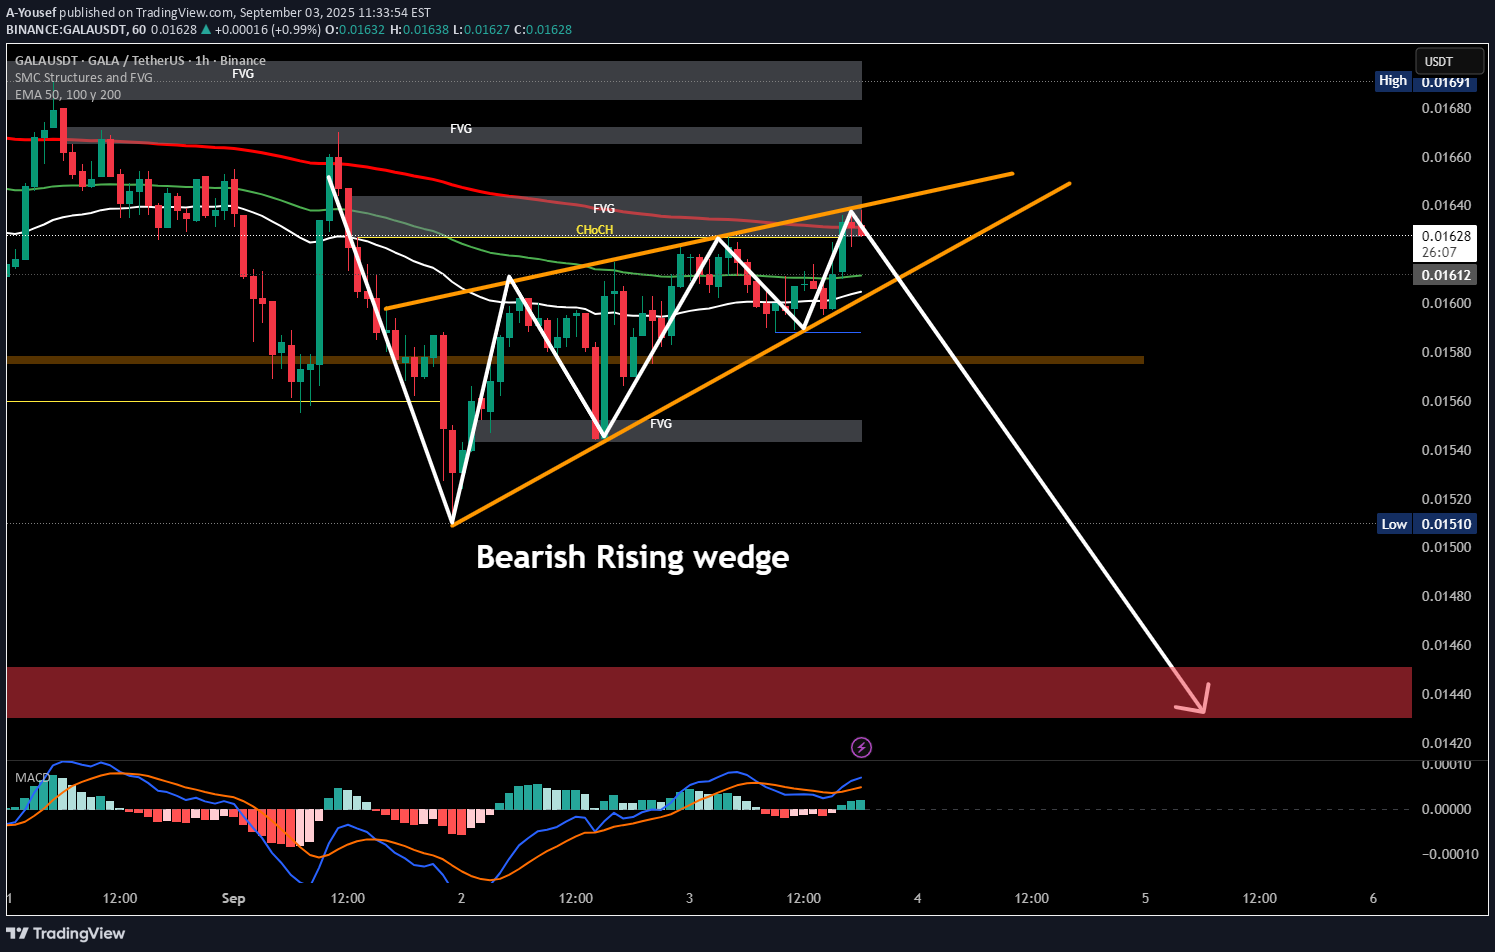
• Price is currently forming a Bearish Rising Wedge. • The move has just rejected from the EMA200 (strong dynamic resistance). • If the wedge breaks to the downside, bearish momentum could accelerate. 🎯 Targets: • First support zone: 0.0158 • Main liquidity zone: 0.0145 ⚠ This is not financial advice.
A-Yousef
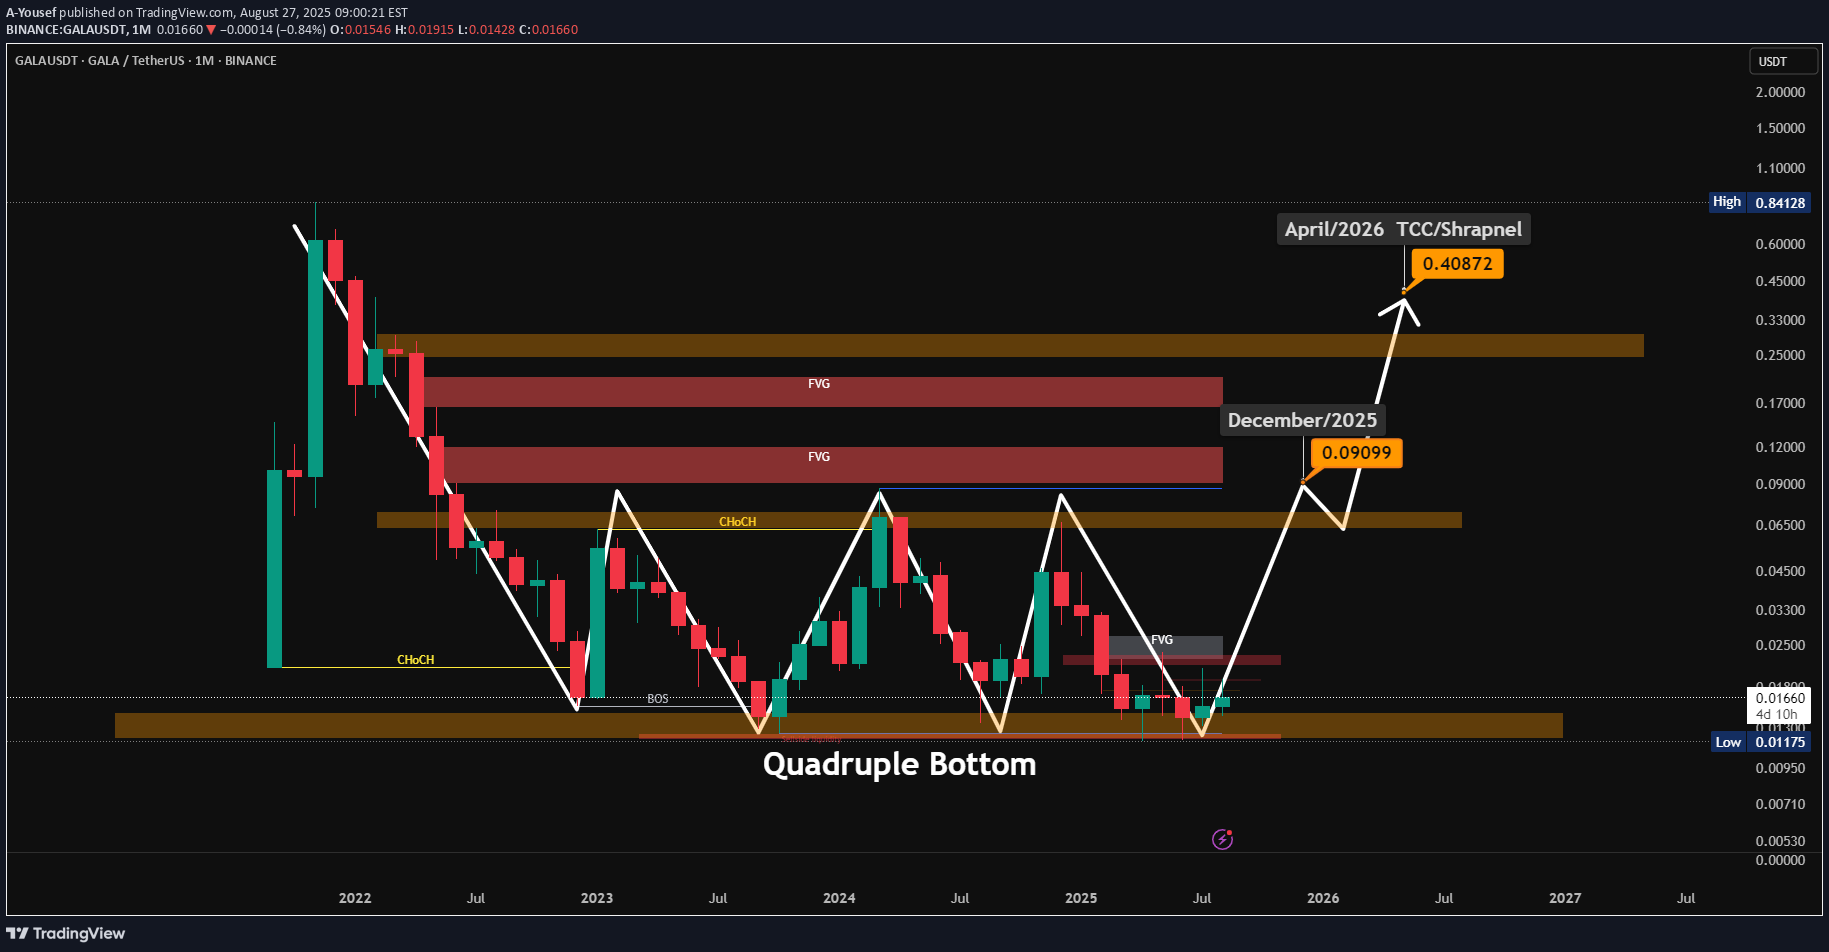
After forming a Quadruple Bottom around the 0.0117$ support, GALA shows strong accumulation signs. A confirmed breakout above the 0.018 – 0.020$ zone could trigger the next bullish leg. Mid-term target (December 2025): 0.09099$ Long-term target (April 2026): 0.40872$ 🚀 Catalyst: A strategic cooperation between GALA, China, TCC & Shrapnel is expected to begin in Q1 2026. This partnership focuses on blockchain gaming and market expansion in China, which could become a major driver for adoption and global exposure of GALA. Key resistance zones are marked by FVG (Fair Value Gaps) which price must reclaim to sustain momentum. With BTC dominance showing strength and market sentiment improving, the probability of a macro trend reversal increases. 📌 This analysis represents my personal market outlook, not financial advice.
A-Yousef
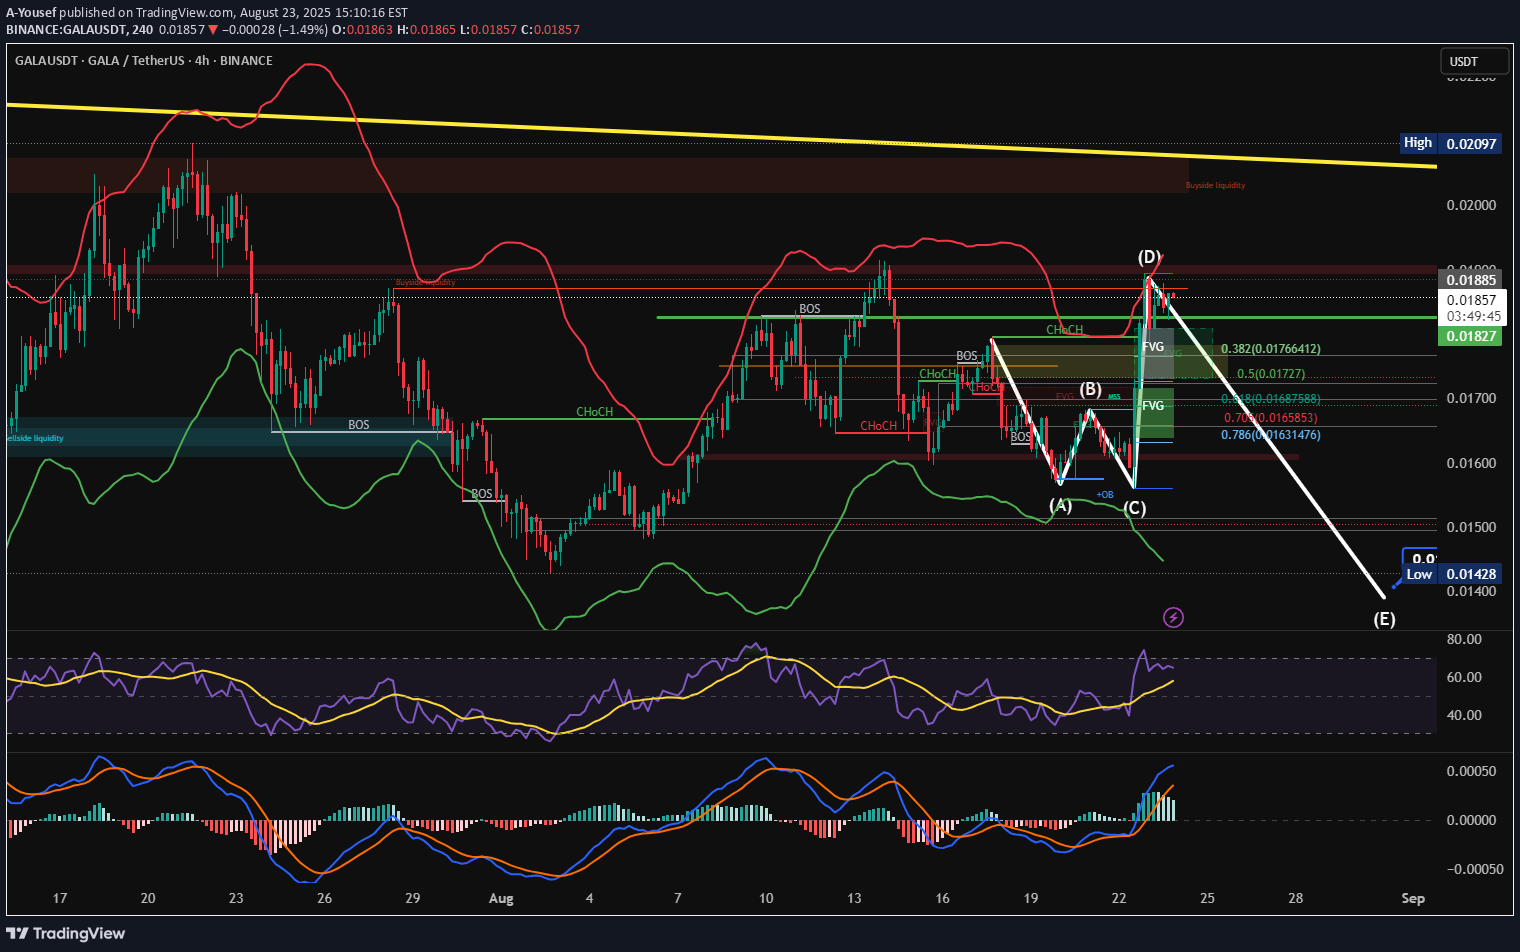
GALA/USDT (4H Analysis) The chart illustrates a detailed Elliott Wave structure forming within the 4H timeframe. Price action recently completed a corrective move (A → B → C) and extended into point (D) before showing potential signs of reversal. Resistance Zones: Price is testing strong supply around 0.0188 – 0.0192, aligned with Fibonacci retracement levels and previous liquidity zones. Support & Downside Targets: If rejection holds, the market may follow the projected (D → E) leg down toward 0.0145 – 0.0140, completing the corrective cycle. Indicators: RSI is approaching overbought conditions, hinting at possible bearish divergence. MACD shows strong momentum, but a cross-down could confirm reversal. Bollinger Bands suggest price touched the upper band and may revert inward. Key Levels to Watch: Resistance: 0.01885 / 0.02000 Mid Support: 0.0172 – 0.0165 (Fib 0.5–0.786) Strong Support: 0.0145 – 0.0140 ⚠️ Outlook: The short-term bias remains corrective bearish unless price breaks and consolidates above 0.0200, which could invalidate the (E) target and open the way for a bullish continuation.
Disclaimer
Any content and materials included in Sahmeto's website and official communication channels are a compilation of personal opinions and analyses and are not binding. They do not constitute any recommendation for buying, selling, entering or exiting the stock market and cryptocurrency market. Also, all news and analyses included in the website and channels are merely republished information from official and unofficial domestic and foreign sources, and it is obvious that users of the said content are responsible for following up and ensuring the authenticity and accuracy of the materials. Therefore, while disclaiming responsibility, it is declared that the responsibility for any decision-making, action, and potential profit and loss in the capital market and cryptocurrency market lies with the trader.