
سیگنال ارز دیجیتال
@g_1379521541

What symbols does the trader recommend buying?
Purchase History
پیام های تریدر
Filter
سیگنال ارز دیجیتال

️ ️ Suspicious displacements from old queen on the eve of the FOMC. 🔴 Nearly 1,000 Bitcoin 12 -year -olds were moved hours ago. 🔖 More than 8,000 bitcoin 3 to 5 years have been moved yesterday. 🚨 This transfers are extremely suspicious and we have to wait for tonight's meeting. 🤫 As Bush comes, the whole market is waiting for today's session.
سیگنال ارز دیجیتال

The OI Index of Intellectual Quinn is increasing and moving away from the Bitcoin OI index. Usually, when such conditions continue, it will eventually improve the market Alert ⚠️
سیگنال ارز دیجیتال
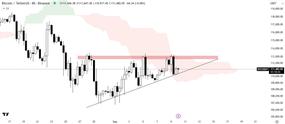
The Bitcoin 8H, while trading within the Ichimoko cloud, is returning from the uptreen triangle support process. Failure or failure confirms the next direction. Carefully monitor future price movements
سیگنال ارز دیجیتال
سیگنال ارز دیجیتال
Trump has threatened Russia nuclear and is not good at the moment, of course, SPX has not been shattered as a result
سیگنال ارز دیجیتال

سیگنال ارز دیجیتال

سیگنال ارز دیجیتال
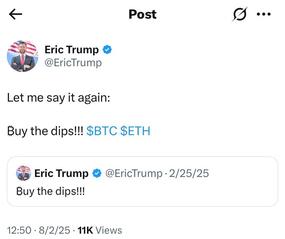
Trump's son: Let me repeat again. These falls are the opportunity to buy (Bitcoin, اتریوم)
سیگنال ارز دیجیتال
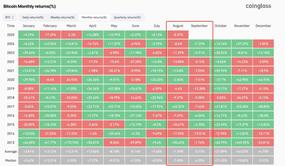
Historically, August and September are the worst months for Bitcoin. In the past 5 years, bitcoin prices in August and September have fallen by 2 %. August and September Are Historically the Worst Months for $ BTC. In Eight of the Past 12 years, $ BTC Prices Fallen in August and September, with A 67% Probability of Decline.
سیگنال ارز دیجیتال
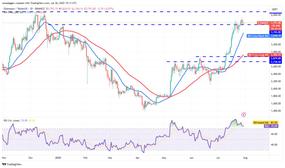
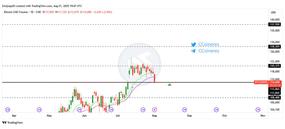
📊 Predict Price اتریوم اتریوم is trying to stay above the $ 1.5 defeat level, indicating that buyers are not in a hurry to sell and expect the price to grow another stage. 📈 Daily Eth/USDT Daily Chart Source: Cointelegraph / TradingView If the price returns from the support level $ 4.9, the ETH/USDT pair can rise up to $ 4.9. Sellers are expected to show serious resistance at this level, but if buyers overcome, the price may quickly jump up to $ 4.9. 📉 In contrast, if the price dropped and closed below the $ 1.2 level, it would indicate buyers' retreat. In this case, the price may drop to $ 4.9 to the simple 2 -day moving average (SMA), where buyers are expected to come into action. If the price returns from this level, buyers will try again to break the overhead resistance.
Disclaimer
Any content and materials included in Sahmeto's website and official communication channels are a compilation of personal opinions and analyses and are not binding. They do not constitute any recommendation for buying, selling, entering or exiting the stock market and cryptocurrency market. Also, all news and analyses included in the website and channels are merely republished information from official and unofficial domestic and foreign sources, and it is obvious that users of the said content are responsible for following up and ensuring the authenticity and accuracy of the materials. Therefore, while disclaiming responsibility, it is declared that the responsibility for any decision-making, action, and potential profit and loss in the capital market and cryptocurrency market lies with the trader.