Technical analysis by Maqabyah about Symbol BTC: Buy recommendation (11/15/2023)

Maqabyah
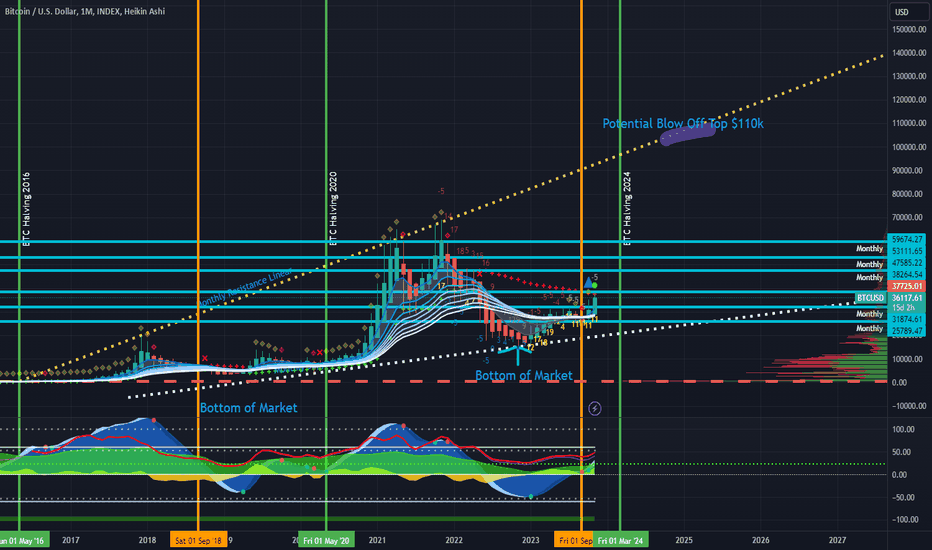
Anticipating Bitcoin's Next Peak 2024/2025 In this analysis, we're taking a close look at Bitcoin's price movement using a monthly chart and focusing on key trendlines that have historically marked significant tops and bottoms in Bitcoin's market cycles. Starting Point - The 2016 Halving: Our analysis begins with a trendline that originates from the Bitcoin halving event in 2016. This yellow trendline, drawn in the form of a ray, touches the bull market peaks of 2017, as well as both double tops in 2021. This gives us an insightful visual representation of Bitcoin's cyclical journey, highlighting its most exuberant peaks. Bear Market Bottoms Trendline: Additionally, a separate trendline marks the bottoms of bear markets. This trendline helps us in estimating potential future bear market lows, providing a comprehensive view of the market's potential high-low ranges. Forecasting the Future - 2023 to 2025: Based on these trendlines and the patterns observed, I'm projecting a speculative forecast for Bitcoin's price. My educated guess points towards a potential Bitcoin top of around $103,000, occurring sometime between October 2023 and May 2025. The upper end of this estimate reaches as high as $110,000. It's important to note that this forecast is made using a linear chart, emphasizing a realistic price target given the historical price movements and trendline analysis. My analysis, while speculative, is grounded in historical trend patterns observed on the Bitcoin chart. Once we get a spot BTC, and ETH ETF, these targets could be much higher depending on the institutional inflow of capital. Until that occurs, these are my targets for the top of the next cycle.
