Technical analysis by StudyGuideTA about Symbol TSLAX on 12/22/2025
StudyGuideTA
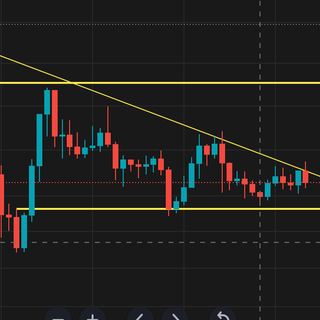
TSLA | 4hr chart

Closing over a yearly (black) level is a sign that longpants will be in fashion but if price is going up then where will it go up from? Lets look below for levels of support and obviously the black yearly level will be where most will be but below that there is an orange 4hr FrontSide support backed by a weekly trend. Might take a while to get there but that's why trading is like fishing. Be patient. there are 4 candles which create 6 levels that illustrate market structure and each level has an expectation. T.A explained - BackSide (BS) FrontSide (FS) Inverse BS (Inv.BS) Inverse FS (Inv.FS) BS & FS levels are expected support when dashed lines, tested when dotted and resistance when solid lines. The inverse is true for the Inv. BS Inv. FS levels, they are resistance as dashed lines, tested as dotted and support as solid lines. Monthly timeframe is color pink weekly grey daily is red 4hr is orange 1hr is yellow 15min is blue 5min is green if they are shown. strength favors the higher timeframe. 2x dotted levels are origin levels where trends have or will originate. When trends break, pricePrice tested the 4hr Backside candle which expectation is to have a strong reaction to price. I always favor the more risk averse expectation from the frontside candle which was not tested. the current 4hr candle has 1hr left and needs to get above the last distribution candle it just created @ 464.36 and create a 1hr ladder above $462 if price is to keep the current momentum trending for long pants.