Technical analysis by MR_gold2 about Symbol PAXG on 21 hour ago

MR_gold2
تحديث الذهب
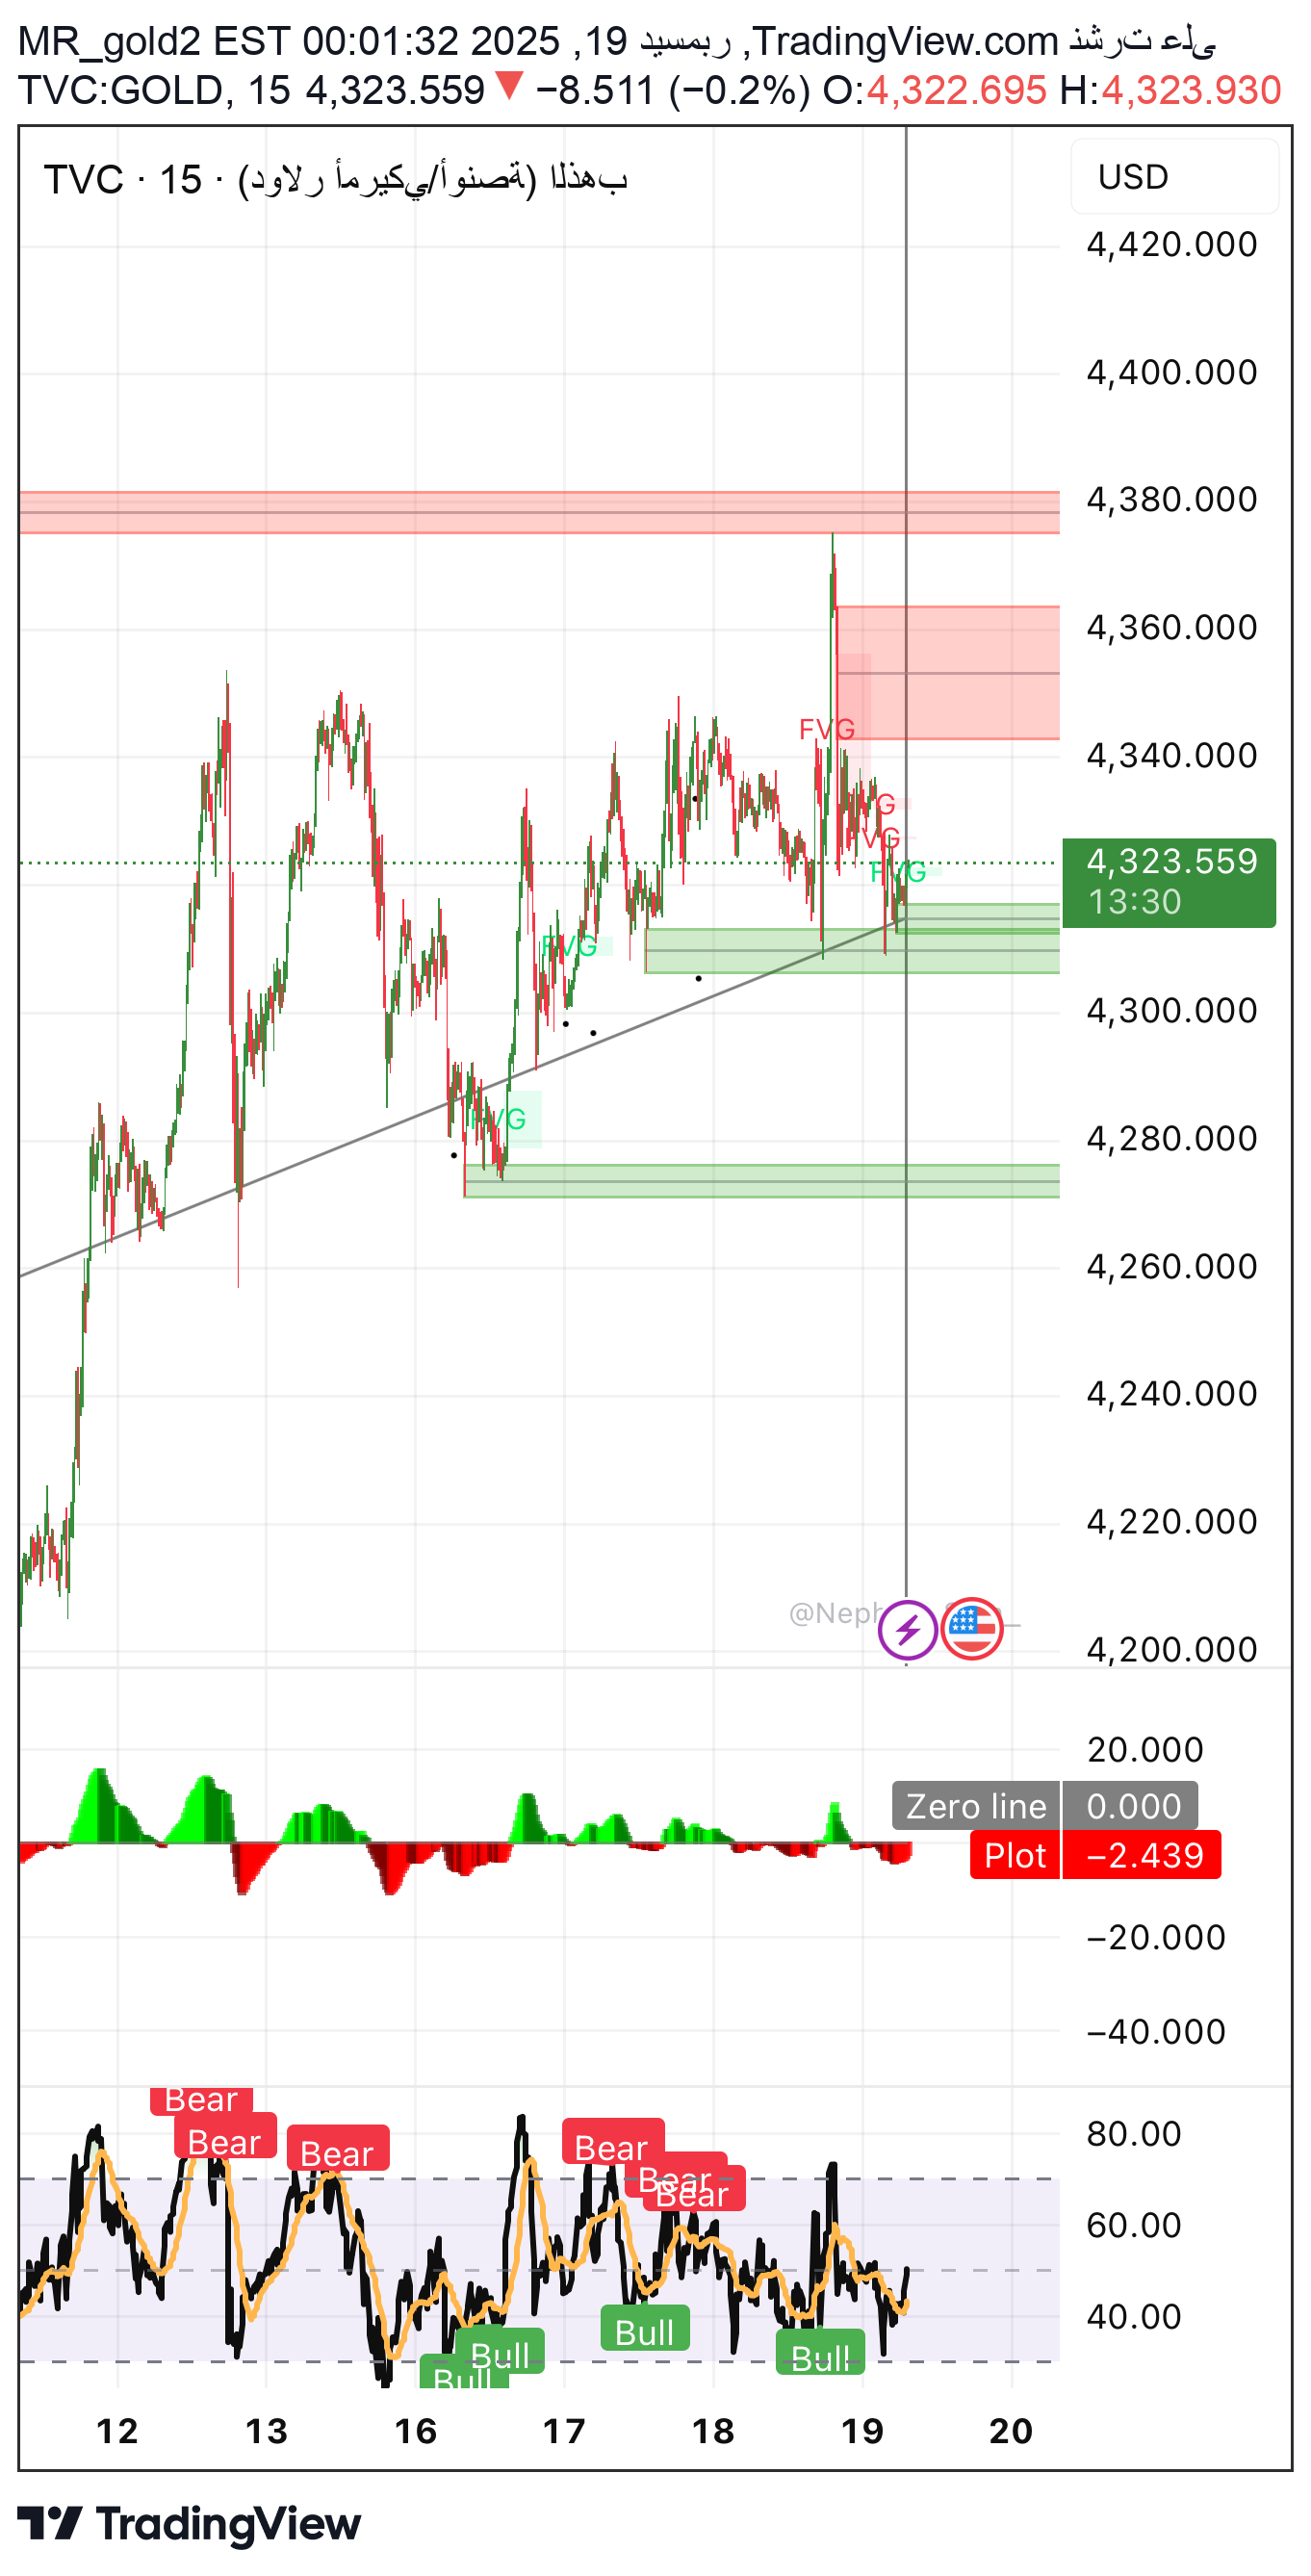
First: Technical Analysis •The price is moving within a medium-term ascending channel. •Currently the price is close to the upper border of the channel with clear weakness in momentum. •The price failed more than once to close clearly above the 4,360 – 4,380 area. •The appearance of a horizontal fluctuation within the channel indicates a phase of distribution and not a release. Technical summary: The general trend is up, but the upward momentum is currently weak and the possibility of a correction exists. ⸻ Second: Elliott Wave analysis We believe that the price ended: •A bullish impulse wave (1–2–3–4–5) on small frames. •Current price within: •Compound corrective wave (ABC or WXY). •The current wave looks like wave B or X (weak retracement). Most likely wave scenario: ✔️ Corrective decline before completing the larger rise. ⸻ Third: Time Analysis •The price spent a long time within the same price range. •Time fluctuation without price progress = near strong movement. •The next movement is often the opposite of the last weak wave. Time summary: We are at a time decision point that tends towards a short-term downward movement. ⸻ Fourth: Digital / Quantitative analysis •High Frequency Zones: •4,330 – 4,340 (trading saturation) •Digital penetration above 4,360 failed more than once. Psychological numbers: •4,350 – 4,380 = Buying exhaustion zone ⸻ Fifth: Fundamental Analysis •The market is currently in a state of: •Anticipation (monetary policy - US data - bond yields). •There is no strong supportive news that pushes for a violent breakthrough now. •Any current strength is considered short-term speculative. Basic takeaway: The fundamentals do not support an immediate strong rise, but rather tend towards a correction. ⸻ Sixth: Price Action •Equal/Lower Highs. •Clear rejection candles near supply areas. •Fake breakouts without strong closure. This is clearly distributive behavior. ⸻ Seventh: Supports and resistances Resistors: •4,350 – 4,380 (very strong supply area) •4,400 (High Psychic Resistance) Supports: •4,300 – 4,290 (first support) •4,260 – 4,240 (axial support) •4,200 (main support) ⸻ Eighth: Technical models Bullish Channel + Volatility = Bullish Channel Distribution •Possibility: •Rising Wedge on small frames (negative pattern) ⸻ Ninth: Digital models •Repeated price rejection from the same area = digital burnout pattern •Weak price response despite heavy trading. ⸻ Tenth: Harmonic models •Probability of formation: •Bearish Gartley or Bat near 4,360 – 4,380 •The model is not complete yet, but it is taking shape. ⸻ Eleventh: Supply and demand areas Sell Zones: •4,350 – 4,380 🔴 (strongest) •4,330 – 4,345 Buy Zones: •4,260 – 4,240 •4,200 – 4,180 ⸻ Twelfth: Fixation Points •Bottom mount point: 4,290 •Top mount point: 4,360 •Breaking either of them with a clear close determines the next trend. ⸻ Thirteenth: Pivot Zone •Current pivot zone: 4,300 – 4,330 •Trading within it = fluctuation •Getting out of it = strong movement ⸻ 🔔 Trading Recommendation 🔻 Preferred scenario (short term): Corrective selling with caution if the price rises to the 4345-4375 areas and any signal appears Stop loss: Clear close above 4,385 Objectives: 1️⃣ 4,300 2️⃣ 4,270 3️⃣ 4,240 ⸻ 🔺 Alternative scenario (in case of cancellation): •Close 15 minutes or hour above 4,385 •Then we cancel the sale and wait for a retest to buy. 🟢 Buy from Retest Support Purchase area: •4,295 – 4,307 Stop loss: It should be close to $10 and no more •4,270 (break of support + break of trend line) Objectives: •🎯 First goal: 4,335 •🎯 Second goal: 4,360 •🎯 Third goal: 4,380 ➡️ This is the current best buy from the neighborhood