Technical analysis by The_STA about Symbol SPYX: Sell recommendation (12/18/2025)

The_STA
نقطه عطف اساندپی 500: آیا هیجان بازار از بین رفته است؟
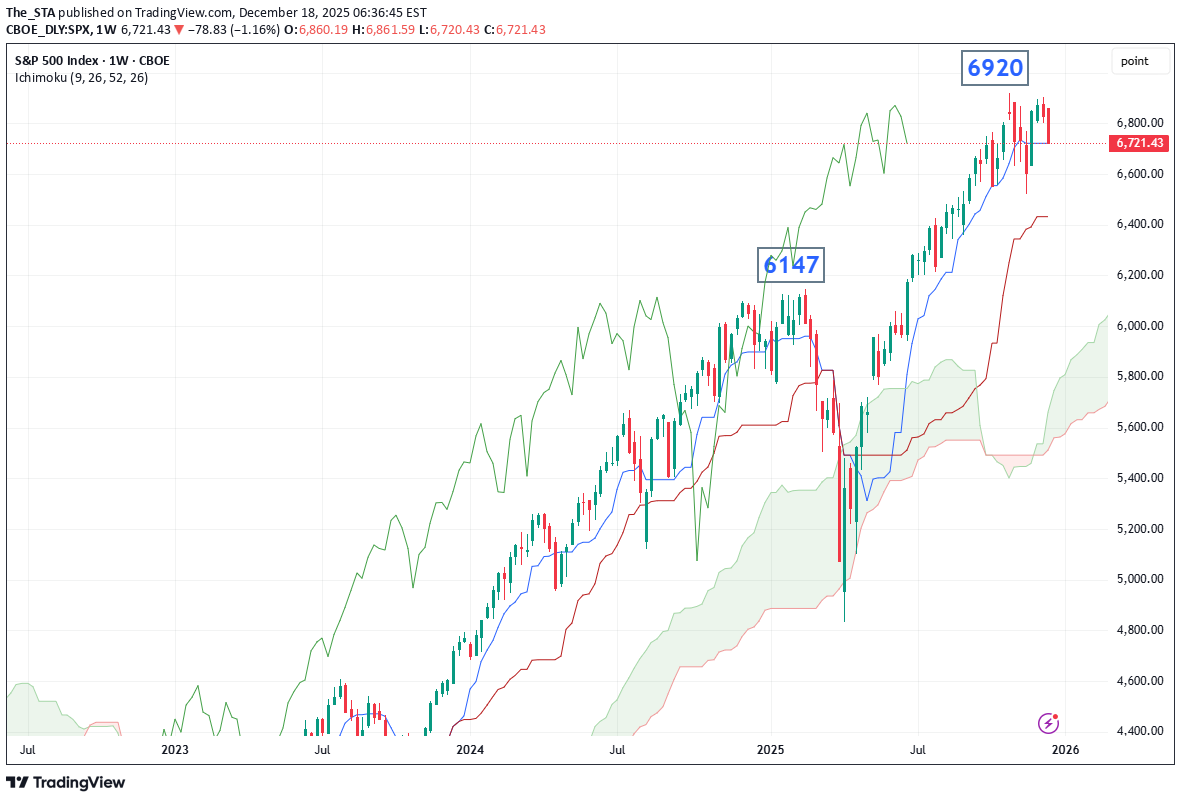
(Educational content only – not investment advice) Momentum isn’t lost in one candle — it fades slowly, then suddenly. Watch the S&P closely. Yesterday’s aggressive sell-off in the S&P has traders asking: is the rally running out of steam? Let’s break down the chart step by step: 🔎 Key Levels to Watch - Resistance: October high at 6,920 – the market failed to push through. - First Support: Base of the daily Ichimoku cloud at 6,640. - Critical Level: November low at 6,522 – a close below here would be seen as a strong negative signal. - Weekly Baseline: 6,432 – next downside target if 6,522 breaks. - Major Low: February high at 6,147 – deeper support zone. 📉 Why It Matters - The S&P is struggling at the top of a long-term up channel dating back to 2009. - Resistance around 7,7400 was expected to provoke failure – and price action is stalling just below. - Momentum looks weak, making a close above 6,920 a tall order for bulls. 🧠 Educational Takeaway This setup highlights how multi-timeframe analysis (daily cloud + weekly baseline + long-term channel) can reveal pressure points in a market. - Support zones show where buyers may step in. - Resistance zones highlight where rallies often fail. - Watching key closes (above 6,920 or below 6,522) helps traders gauge momentum shifts.