Technical analysis by ActuaryJ about Symbol PAXG on 12/18/2025

ActuaryJ
XAUUSD: Market Analysis and Strategy for December 18th
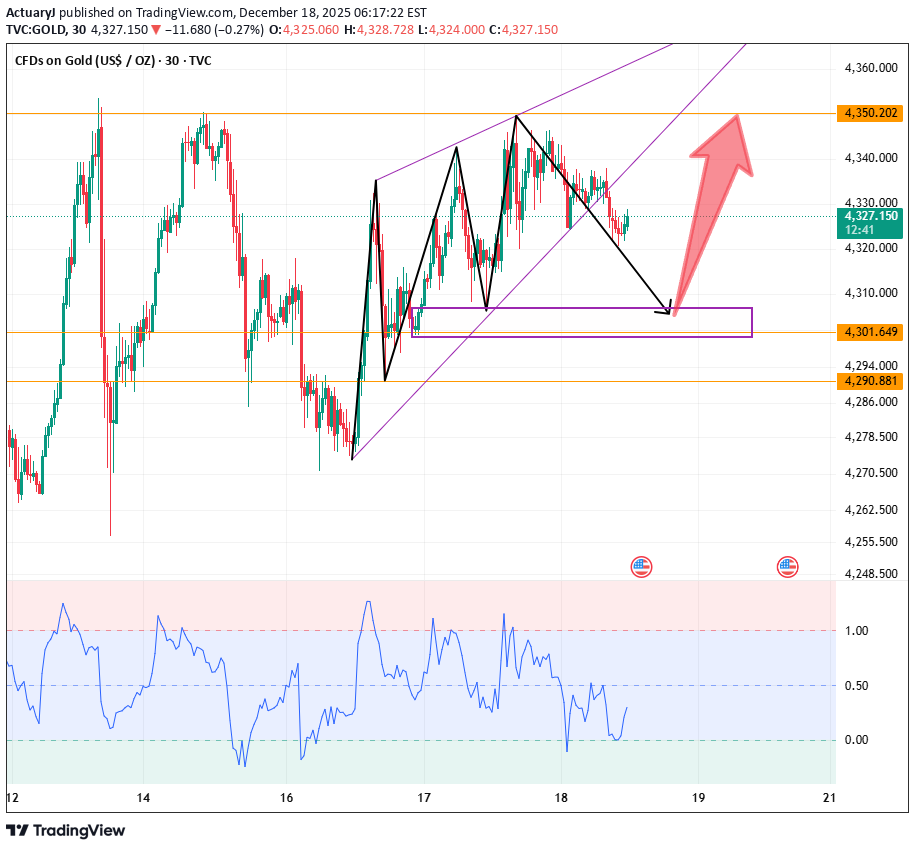
Gold Technical Analysis: Daily Resistance: 4382, Support: 4175 4-Hour Resistance: 4350, Support: 4290 1-Hour Resistance: 4338, Support: 4302 The 4-hour chart shows that although gold prices have experienced a slight pullback during the day, the overall technical pattern remains bullish: moving average support is gradually moving upwards. The Bollinger Bands are expanding, indicating increased volatility; the RSI indicator is running above the 50 midline, suggesting that bullish momentum has not been broken. If the bulls continue to exert force and effectively break through the upper Bollinger Band near $4350, gold prices are expected to challenge the historical high of $4380 again, and then launch an attack on the psychological level of $4400. Conversely, if the pullback continues and falls below $4290 (the low of December 17), it may trigger more stop-loss orders for bullish positions in the short term. Close attention should be paid to the support levels around $4270 and $4230. The key resistance level for the NY market is 4353-4366, while the support level is 4302-4285. The short-term support/resistance level is 4302. My personal suggestion: prioritize buying on dips; selling is a secondary strategy. Trading Strategy: SELL: 4347~4340 BUY: 4305~4312 More Analysis →After the CPI release, prices fell from 4336 to 4325. Selling could yield short-term profits, but buying on dips remains the best strategy. Latest Strategy: Capitalizing on the significantly bullish CPI data for gold, we remain bullish! BUY!❗️ It will at least reach 4350-4353. After breaking through here, it will be around 4382. Let's look forward to it.🙏🏻If you bought in around 4310, it has already risen by 130 pips.