Technical analysis by Henrybillion about Symbol PAXG on 12/18/2025

Henrybillion
XAUUSD (Gold) Intraday Outlook
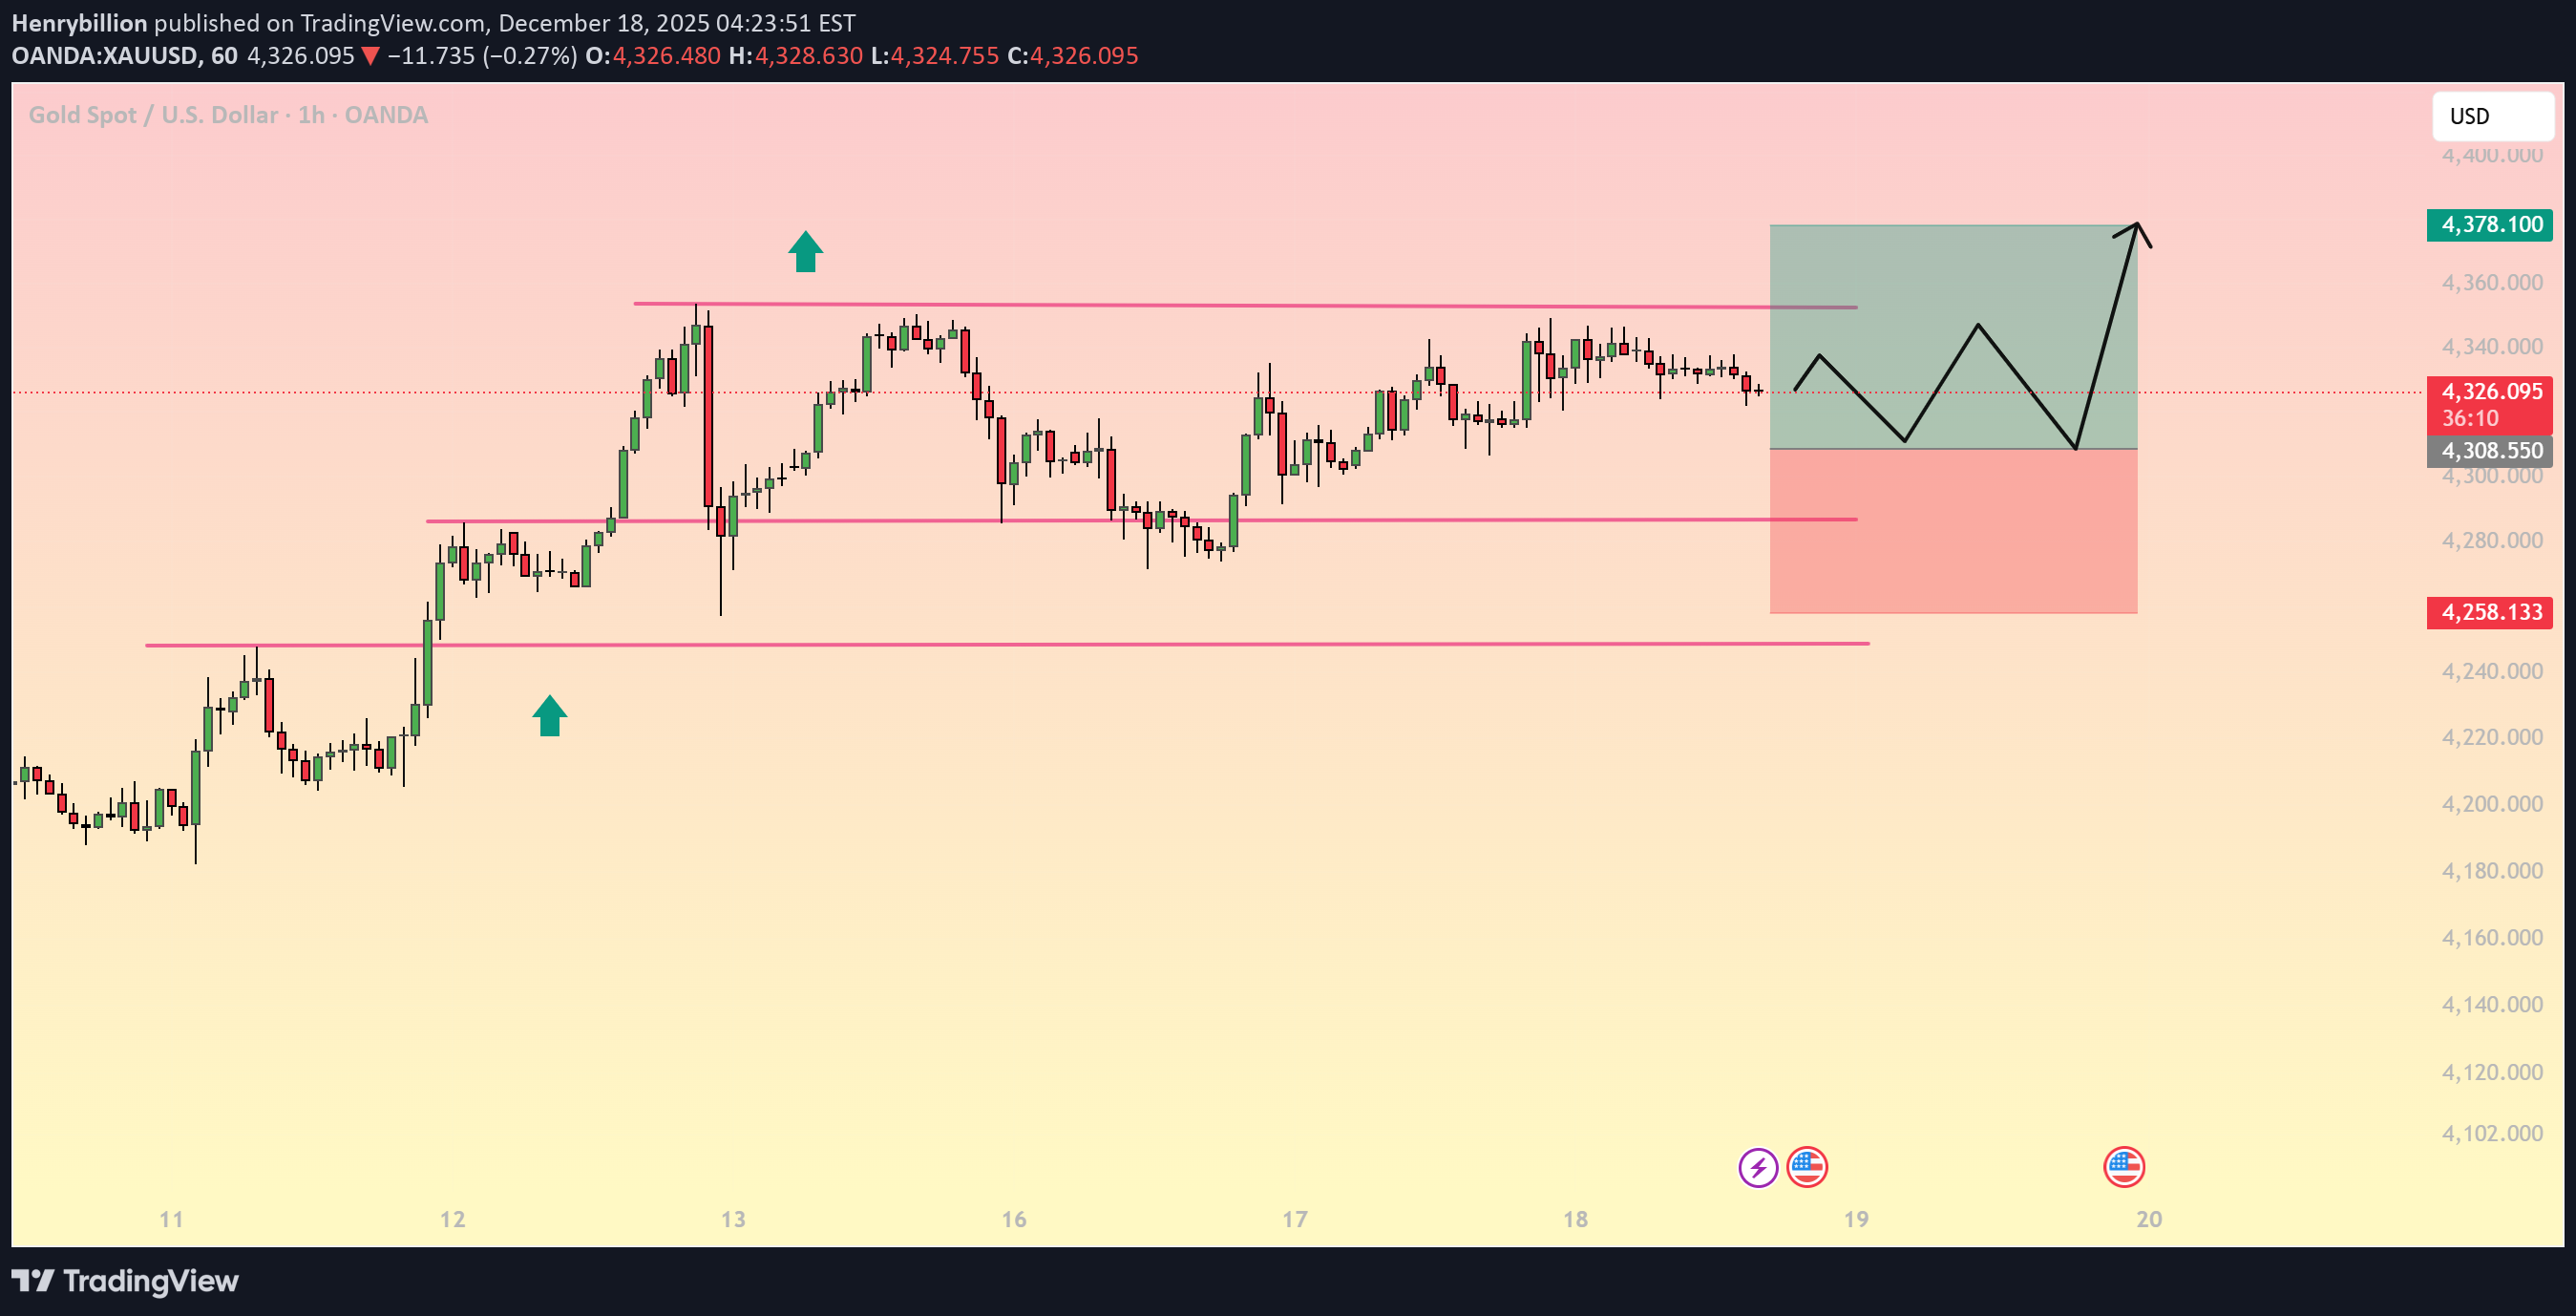
XAUUSD (Gold) Intraday Outlook – Dec 18, 2025 | Key Support/Resistance, Fibonacci, EMA & RSI Plan (H1) Gold is consolidating on the H1 chart after a strong prior push. Price is currently compressing just below a clear supply zone, which often creates a “range first, breakout later” type of session. Today’s edge is simple: trade the boundaries of the box, then follow the direction of the confirmed break. Market Structure on H1: Range Under Supply (Bullish Bias While Supported) From the chart, gold is holding a higher base and printing tight candles near the upper half of the range. This is typically absorption: sellers defend the top, buyers keep refilling dips. As long as price respects the demand area, the probability favors a break higher to take the liquidity above the recent swing highs. The projection on the chart also matches this logic: multiple swings inside the box (liquidity building), then a strong breakout leg. Key Levels That Matter Today (Support & Resistance) Major Resistance (Sell-side supply / breakout triggers) 4345 – 4355: primary resistance band (range ceiling + repeated rejections) 4378.1: first upside objective after a clean breakout (measured move / target zone) 4400 (psychological extension): only if momentum expands after 4378 Major Support (Buy-side demand / invalidation zones) 4305 – 4312: first key support (range floor inside the current structure) 4285 – 4292: deeper support (breakdown retest zone / Fibonacci confluence area) 4258.1: major invalidation support (if this fails, bullish idea is structurally wrong) Fibonacci Map (How to Use It Today) Use Fibonacci from the most recent impulsive leg low → swing high (the leg that built this range). On this chart, the “decision zone” aligns with: 0.5 retracement area around 4300–4310 (strong “dip buy” magnet in uptrends) 0.618 retracement area around 4285–4292 (often the “last defense” before breakdown) Below that, 4258 becomes the “line in the sand” Trading idea: if price keeps reacting cleanly from the 0.5–0.618 region and reclaims intraday structure, it supports a continuation push. Trendline Logic (Simple Confirmation Tool) Draw an ascending trendline connecting the rising swing lows (left side of the chart into the current base). If price keeps respecting the trendline while holding 4305–4312, bias stays bullish. If H1 closes below the trendline and then retests it from underneath, that is a higher-quality sell confirmation than selling the first break. EMA & RSI (Execution Filters, Not Predictions) Because the chart screenshot doesn’t show indicators on-screen, use this as a practical filter when you apply them: EMA (20/50) Filter Bullish continuation is cleaner when EMA20 > EMA50 and price holds above EMA50 on H1. If price chops through EMA50 repeatedly, stay strict and trade only the range edges with confirmation. RSI (14) Filter Bullish control often shows RSI holding above 50 during pullbacks. If RSI loses 50 and fails to recover on rebounds, expect deeper support tests (4285–4292, possibly 4258). High-Probability Trading Strategies for Today Strategy A: Buy the Dip in the Range (Preferred While Above 4305) Entry idea Look for buys in 4305–4312 Confirmation: M15/H1 bullish engulfing, reclaim of the micro swing high, or rejection wicks with follow-through Targets TP1: 4345–4355 TP2: 4378.1 Runner: toward 4400 only if breakout candles expand Stop-loss Conservative: below 4285 Wider/invalidation-based: below 4258.1 Best use-case: when price taps demand and immediately returns into the range with strong candle bodies (not slow drifting). Strategy B: Breakout & Retest Buy (If 4355 Breaks Cleanly) Trigger H1 close above 4355, then a pullback that holds above the broken zone Entry Buy the retest of 4345–4355 after confirmation (do not chase the first spike) Targets 4378.1 then extension if momentum remains strong Stop-loss Back inside the range (below the retest low) Best use-case: when breakout is supported by strong bodies and minimal upper wicks (real demand, not just a stop run). Strategy C: Breakdown Sell (Only If 4305 Fails With a Close) Trigger H1 close below 4305, then retest fails Targets TP1: 4285–4292 TP2: 4258.1 Stop-loss Above the retest swing high (back inside the range) Best use-case: when breakdown shows expansion and the retest is weak (small bodies, repeated rejection).