Technical analysis by CryptoSanders9563 about Symbol XRP: Buy recommendation (12/18/2025)

CryptoSanders9563
XRP/USDT – Chart Analysis (Weekly)
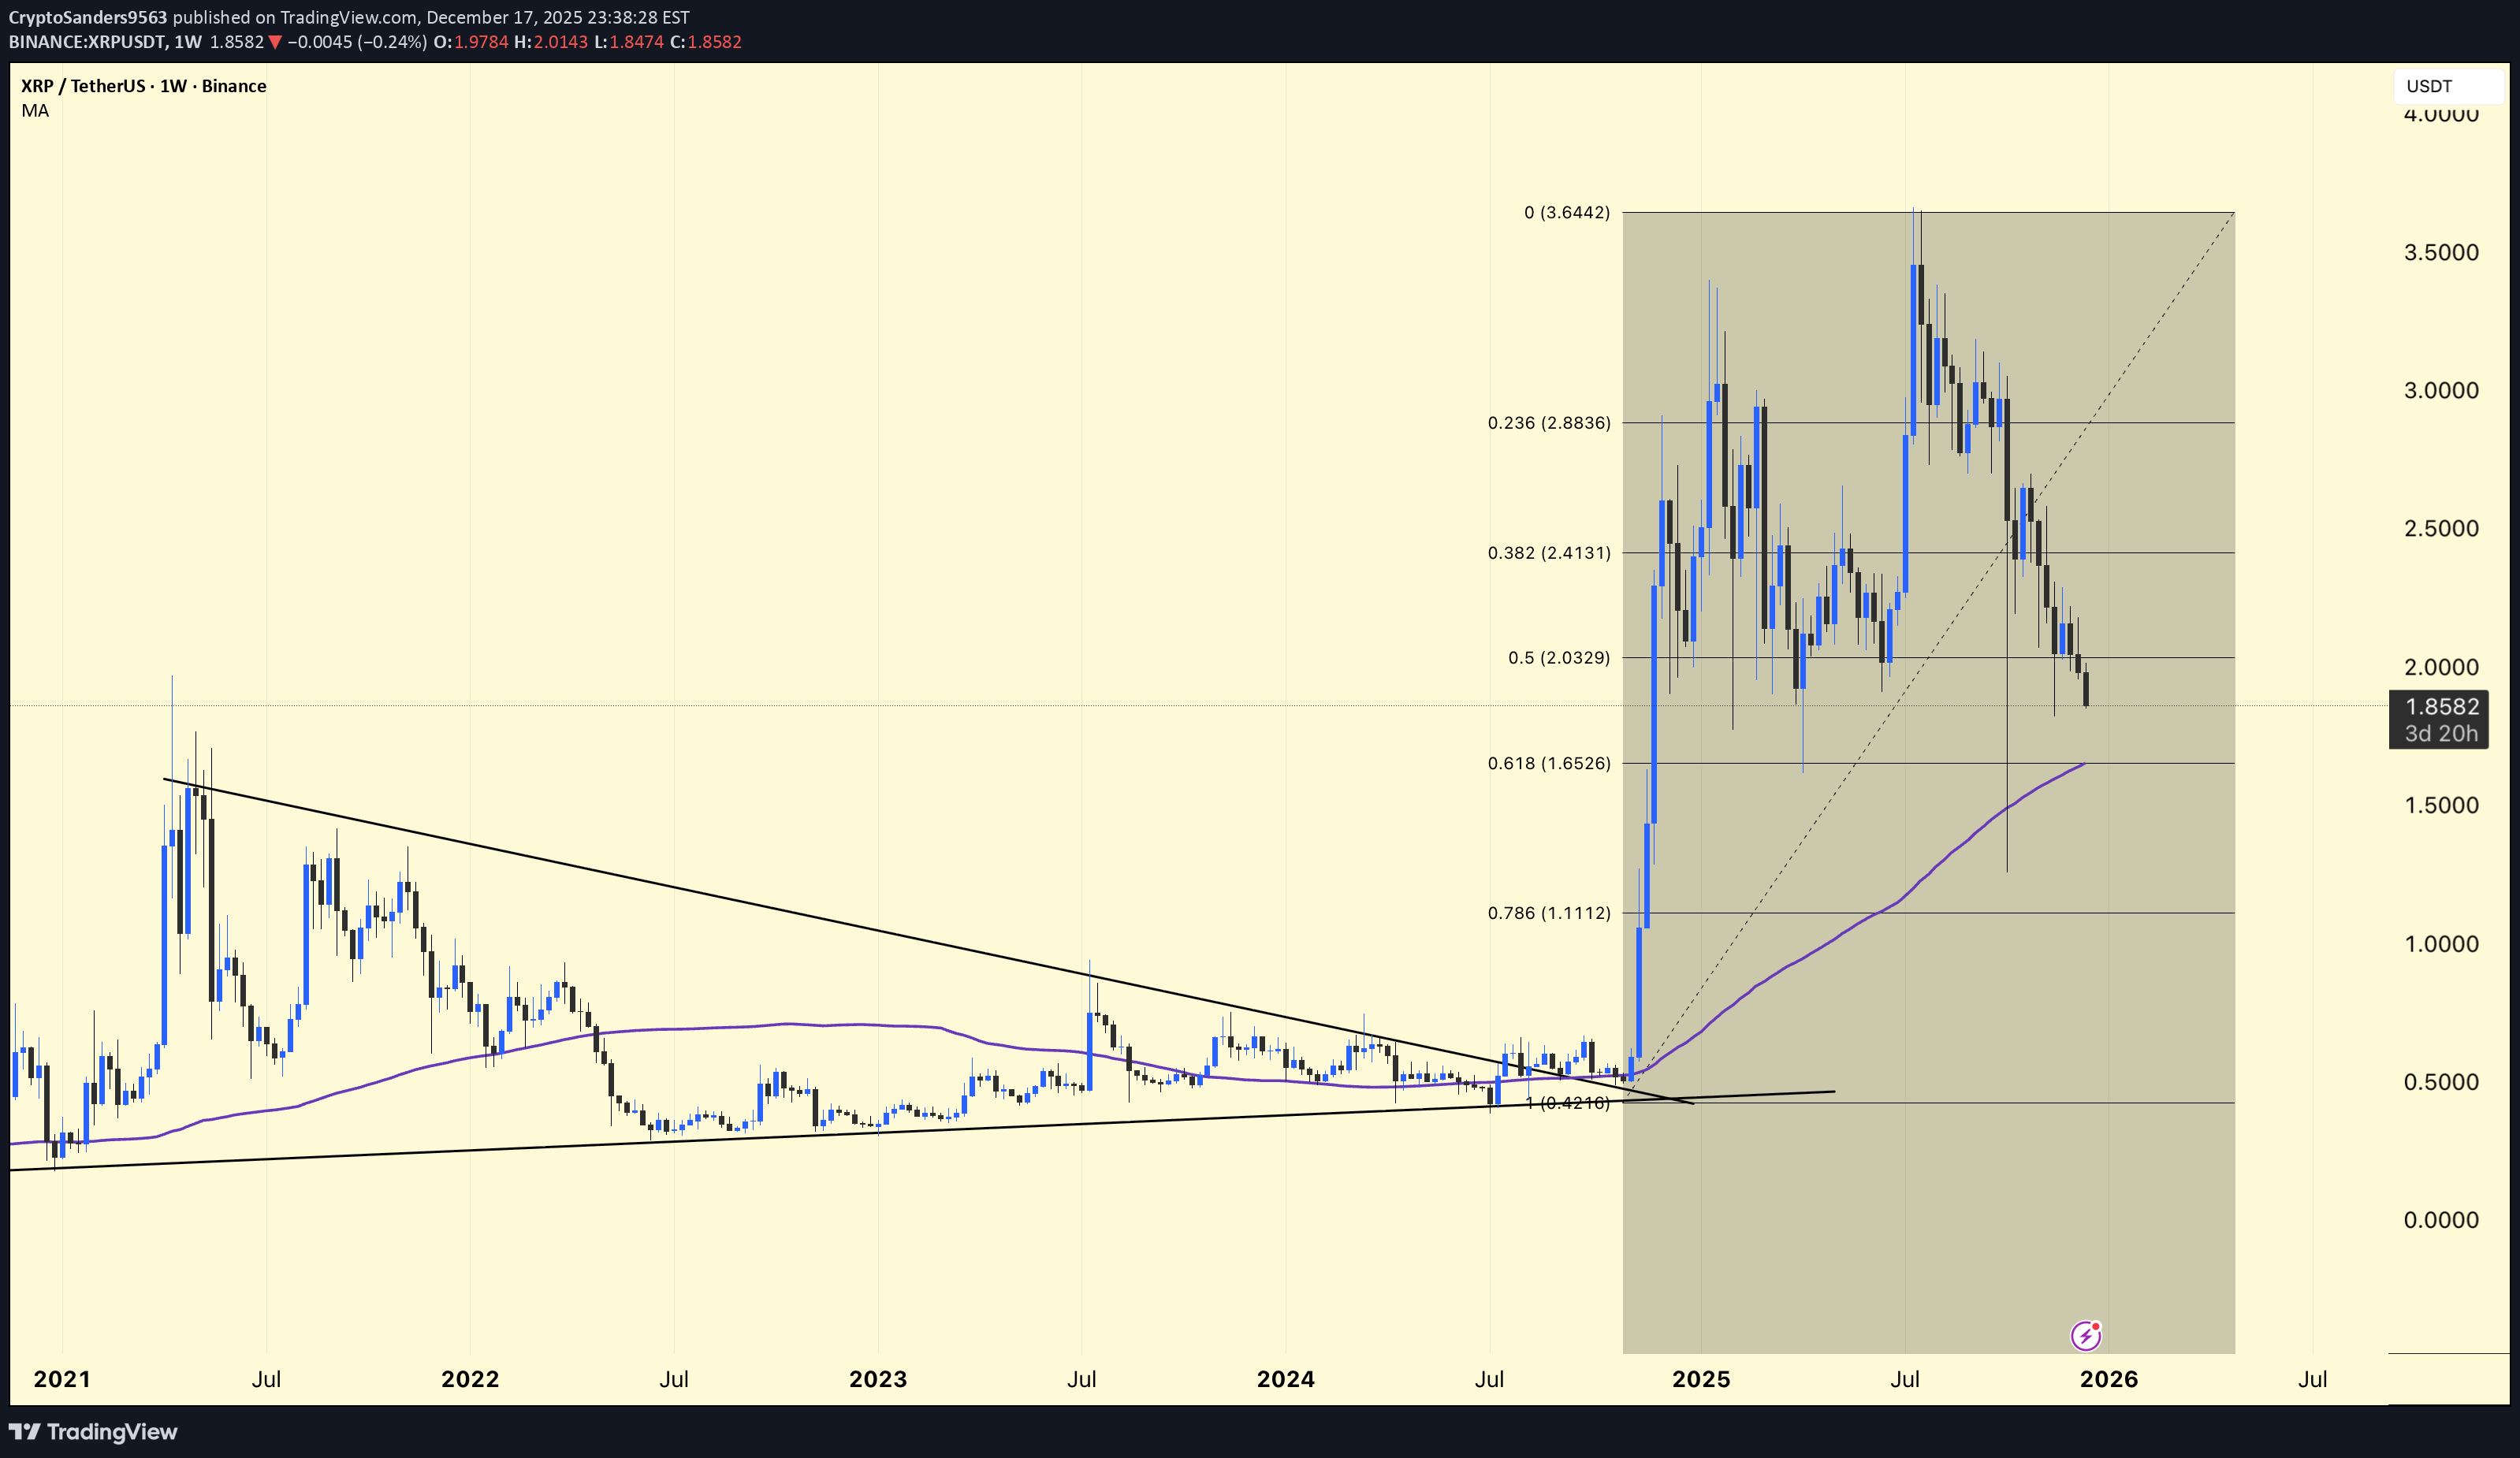
XRP/USDT – Chart Analysis (Weekly) XRP has broken out of a multi-year downtrend line → confirming a major trend reversal Strong impulsive rally after prolonged accumulation The current price action is a healthy corrective pullback, not a bearish reversal As long as the higher support zones hold, the structure remains bullish. Fibonacci Analysis. (Fibonacci drawn from macro low → to recent high) 0.236 – 2.88 → Strong rejection zone (local top) 0.382 – 2.41 → Supply / Resistance 0.5 – 2.03 → Mid-range level 0.618 – 1.65 → Golden Support Zone 0.786 – 1.11 → Strong demand and last bullish defense The price is currently trading between 0.5 and 0.618, close to a high-probability demand zone. Moving Average Confirmation The price is still above the rising weekly MA (~1.65) The MA is acting as dynamic support In a bull cycle, the price often dips below the MA and recovers As long as the weekly closes remain near/above the MA, the bullish trend remains intact. DYOR | NFA.