Technical analysis by readCrypto about Symbol JST on 12/17/2025

readCrypto
The key is whether the price can break above the 0.04032-0.04342
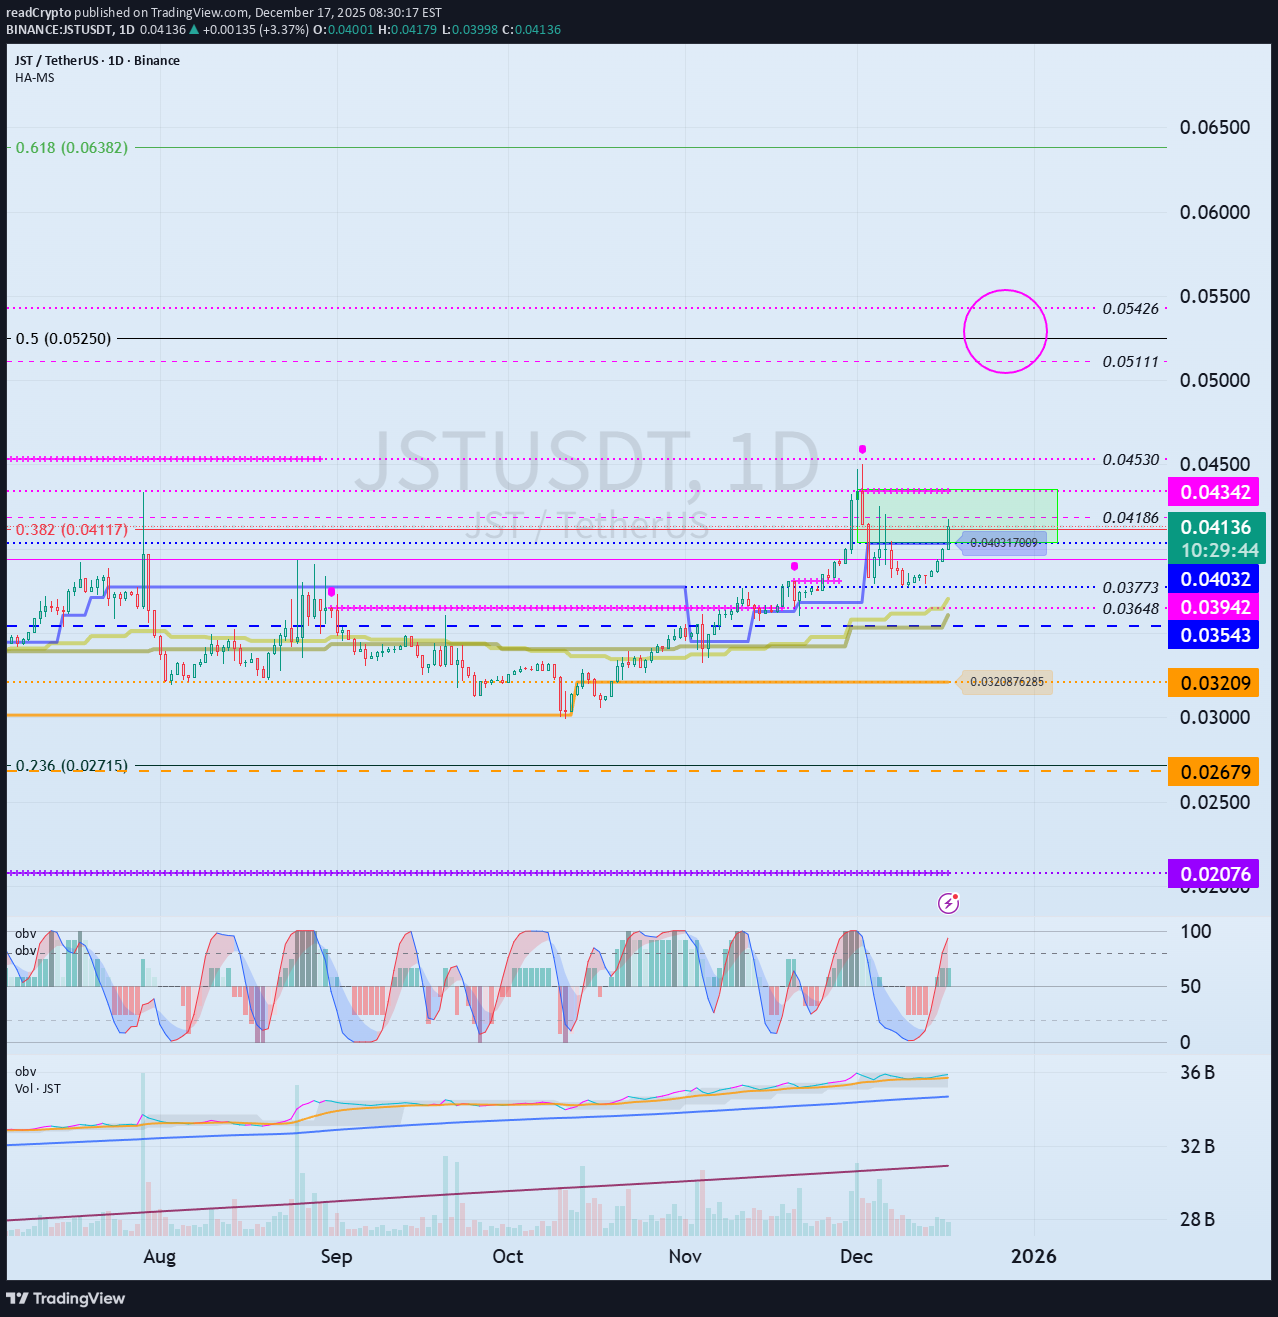
Hello, traders! Follow us to get the latest information quickly. Have a great day. ------------------------------------- (JSTUSDT 1M chart) If the price holds above 0.03942, a full-scale uptrend is expected to begin. - (1W chart) If the price rises with support near 0.03942, an upward breakout near 0.05111 is likely to initiate an uptrend. If the price fails to rise and falls, 1st: 0.03543 2nd: 0.02679 We should check for support near the 1st and 2nd levels above. - (1D chart) The HA-High ~ DOM(60) range is formed between 0.04032 and 0.04342. Therefore, a breakout above 0.04032 and 0.04342 is necessary for a stepwise uptrend to occur. The first resistance level of the step-up trend is expected to be around 0.05111-0.05426. Since the M-Signal indicator on the 1M chart is passing around 0.03543, if it falls below 0.03543, it's advisable to halt trading and assess the situation. To break above a key point or range and continue the uptrend, the StochRSI, TC, and OBV indicators must show upward trends. If possible, - The StochRSI indicator should not enter the overbought zone. - The TC indicator should remain above zero. - The OBV indicator should remain above the High Line. Currently, the StochRSI indicator has entered the overbought zone, which could limit the upside. To overcome this and continue the uptrend, trading volume must increase explosively. If not, you should look for a sideways movement and see if it tests support. - Thank you for reading. I wish you successful trading. --------------------------------------------------