Technical analysis by tradecitypro about Symbol FET on 12/14/2025

tradecitypro
تحلیل FET: محدوده کلیدی، خرسها در کنترل – فرصتهای معاملاتی کوتاهمدت
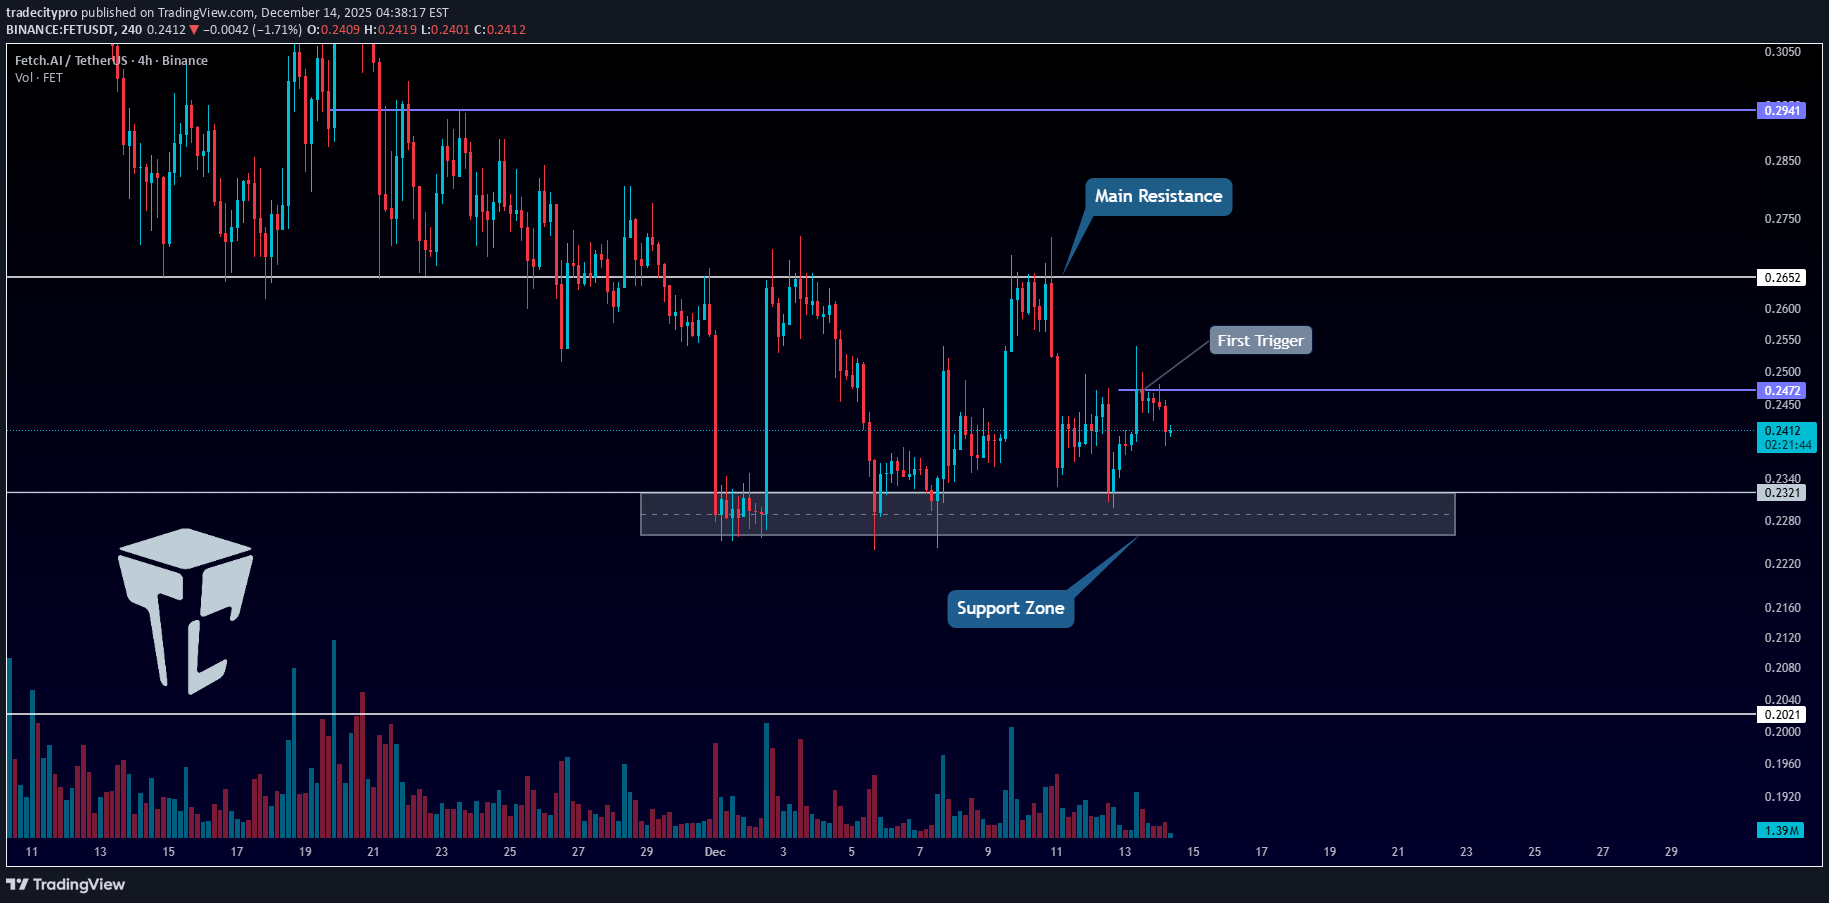
👋 Welcome to TradeCity Pro! In this analysis, I want to review FET, one of the AI projects, which with a market cap of $558 million is ranked 80th on CoinMarketCap. ⏳ 4-hour timeframe On the 4-hour timeframe, this coin is ranging between the zones 0.2321 and 0.2652. 💥 The overall trend for FET is currently bearish, but the price is now ranging between these two zones and forming a new structure. ⚡️ After the last time the price reached 0.2652, it got rejected, and volume started decreasing, and it is still decreasing. ✔️ The bottom of the range can also be considered as a support zone. Breaking this zone would be a very good trigger for a short position, and the price could move towards 0.2021 after breaking this level. 🎲 The middle line of the range is at 0.2472, and breaking this level will give us a early long trigger. ✨ The next level we can open the main long position after breaking is 0.2652. 📝 Final Thoughts Stay calm, trade wisely, and let's capture the market's best opportunities! This analysis reflects our opinions and is not financial advice. Share your thoughts in the comments, and don’t forget to share this analysis with your friends! ❤️