Technical analysis by Nabi_Gunduz about Symbol PAXG on 12/13/2025

تحلیل طلا (ONS ALTIN): شکست سطح مهم ۴۲۴۵ و اهداف صعودی جدید!
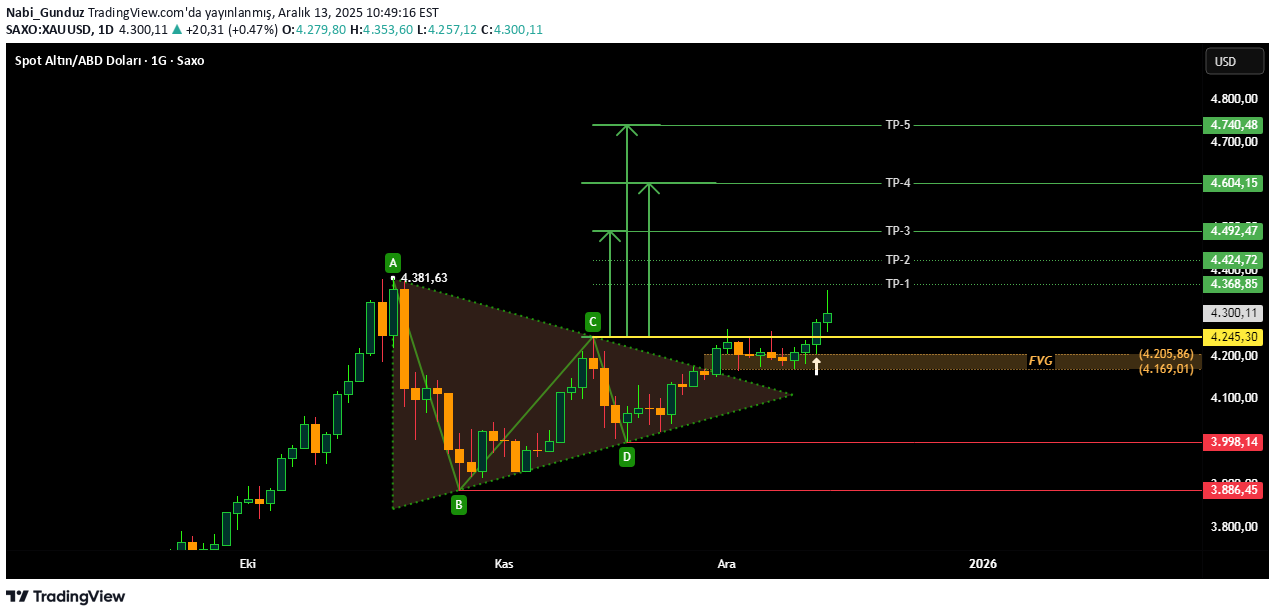
Hello, The 4245 level, which is an important level in the daily time frame, was broken upwards 1 day after the FED's interest rate decision, and many formations produced BUY signals in different time frames. In fact, some Buy signals formed in small time frames such as 4 and 1 hour have already reached their targets... I tried to share them with you in an up-to-date manner under my last post. I will try to share with you the signals that may occur in small time periods within the next week, whenever I have the opportunity under this post. Now let's start examining our main chart; In our daily time chart, 3 bullish formations became active with the 4245 breakout and all three of them have different targets. After the upward break of the "CD" wave structure within the triangle, the formation with its main target at 4392 (TP-3) and its semi-target at 4368 (TP-1) levels is the first upward formation. The main target for Pattern123 formed by the "BCD" wave structure is 4604 (TP-4) and the semi-target of the formation is 4424 (TP-2). The main target of the "ABCD" triangle is 4740 (TP-5), and its semi-target is 4392, which is the TP3 level... It should not be forgotten that not every formation has a rule that will work. Because these formations have 2 stop levels and they are far away from the current level of the price. The stoploss level of the first formation must be below 3998, and the stoploss level of the 2nd and 3rd formations must be below 3886. A stop loss can also be placed with the daily candle closing below the FVG region, which I have highlighted in orange on the chart. In fact, a downward break of this region will create the possibility of a new downward wave... In this 4-hour chart, pattern123, which produced a buying signal according to the 12-depth wave structure seen in blue, has reached its targets, but pattern123, seen in green, has not yet reached the TP-1 level, which is the half-target of the formation. If this formation based on the 20-depth wave structure works, the targets to which the price can go are available on the chart. In this chart on the 4-hour time period, you see a Bullih Pennant (bullish pennant) formation. The target for the triangular part of the pennant has been reached. If the direct part of the pennant If he wants to target it, around 4500 could be the target... I will try to explain possible wave structure scenarios in the NOTE section below this analysis. HAPPY HOLIDAYS... For the price that is in the third wave of the main wave structure that occurs over long time periods such as annually, there is a possibility that the wave structure in the first two charts above will also occur. A downward wave that may occur before a new ATH occurs, and the scenario in this chart may come into play when the Red A level in the second chart is crossed downwards. If a new ATH occurs, there is a possibility that the scenario in the first chart will come into play. The third graph shows the internal structure of an impulse wave. A different bearish wave structure scenario could be as follows. The downward wave structure of a new ATH will differentiate the scenarios and the downward scenarios in these drawings will be canceled.