Technical analysis by DrForexPhd about Symbol BTC: Buy recommendation (12/13/2025)

DrForexPhd
بیت کوین در تله مثلث متقارن: آماده انفجار صعودی یا ریزش ناگهانی؟
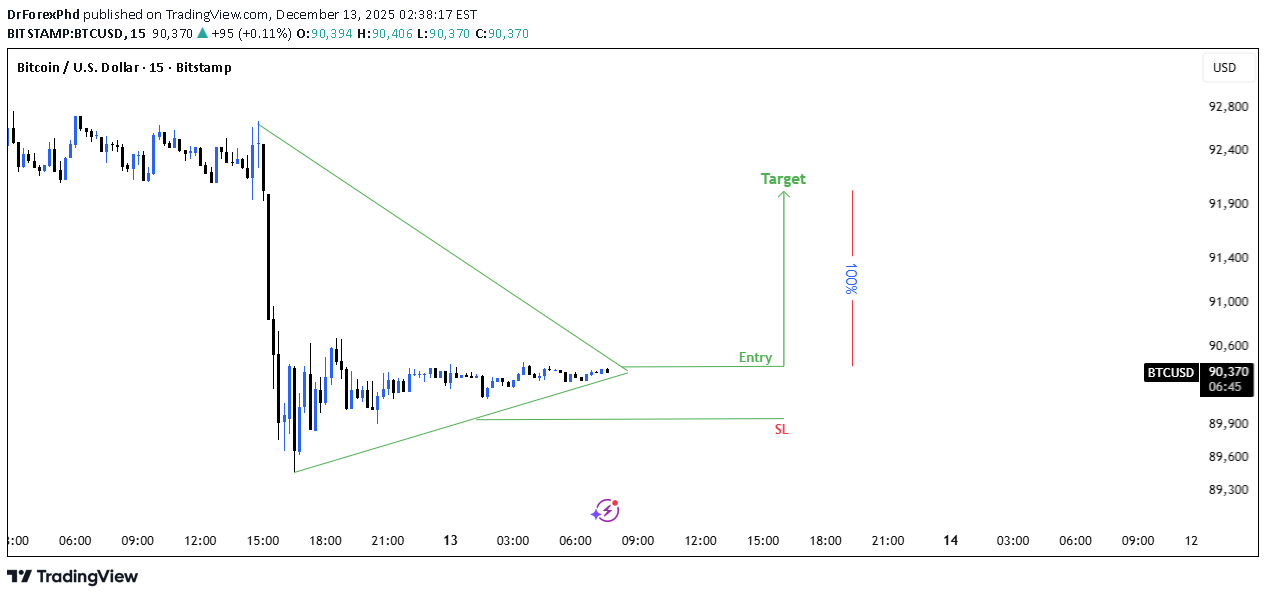
Analysis: Market Structure: After a sharp bearish impulse (strong sell-off), BTC entered a consolidation phase, forming a symmetrical triangle. This indicates balance between buyers and sellers after high volatility. Trend Context: The impulse move before the triangle was downward, but price has stabilized and volatility is compressing — often a precursor to a strong breakout. Pattern Details: Lower highs and higher lows are clearly converging. Price is currently near the apex, where breakout probability increases. Bias: The drawn plan suggests a bullish breakout scenario. Entry is placed slightly above triangle resistance to avoid false breakouts. Trade Plan (as illustrated): Entry: On confirmed breakout above the triangle resistance Target: Measured move projection upward (roughly equal to the triangle’s height) Stop Loss (SL): Below triangle support to invalidate the setup Risk–Reward: Favorable R:R, as the stop is tight relative to the projected upside. Confirmation to Watch: Strong bullish candle close above resistance Increase in volume on breakout Failure signal if price breaks down instead and closes below support Conclusion: BTCUSD is coiling inside a symmetrical triangle after a high-momentum drop. The setup favors a volatility expansion trade, with a bullish breakout being the planned direction — but confirmation is essential. A downside breakout would invalidate the bullish bias and shift momentum back to sellers.