Technical analysis by readCrypto about Symbol SUI on 12/13/2025

readCrypto
آغاز موج صعودی قوی: آیا قیمت از مرز 2.1446 عبور میکند؟
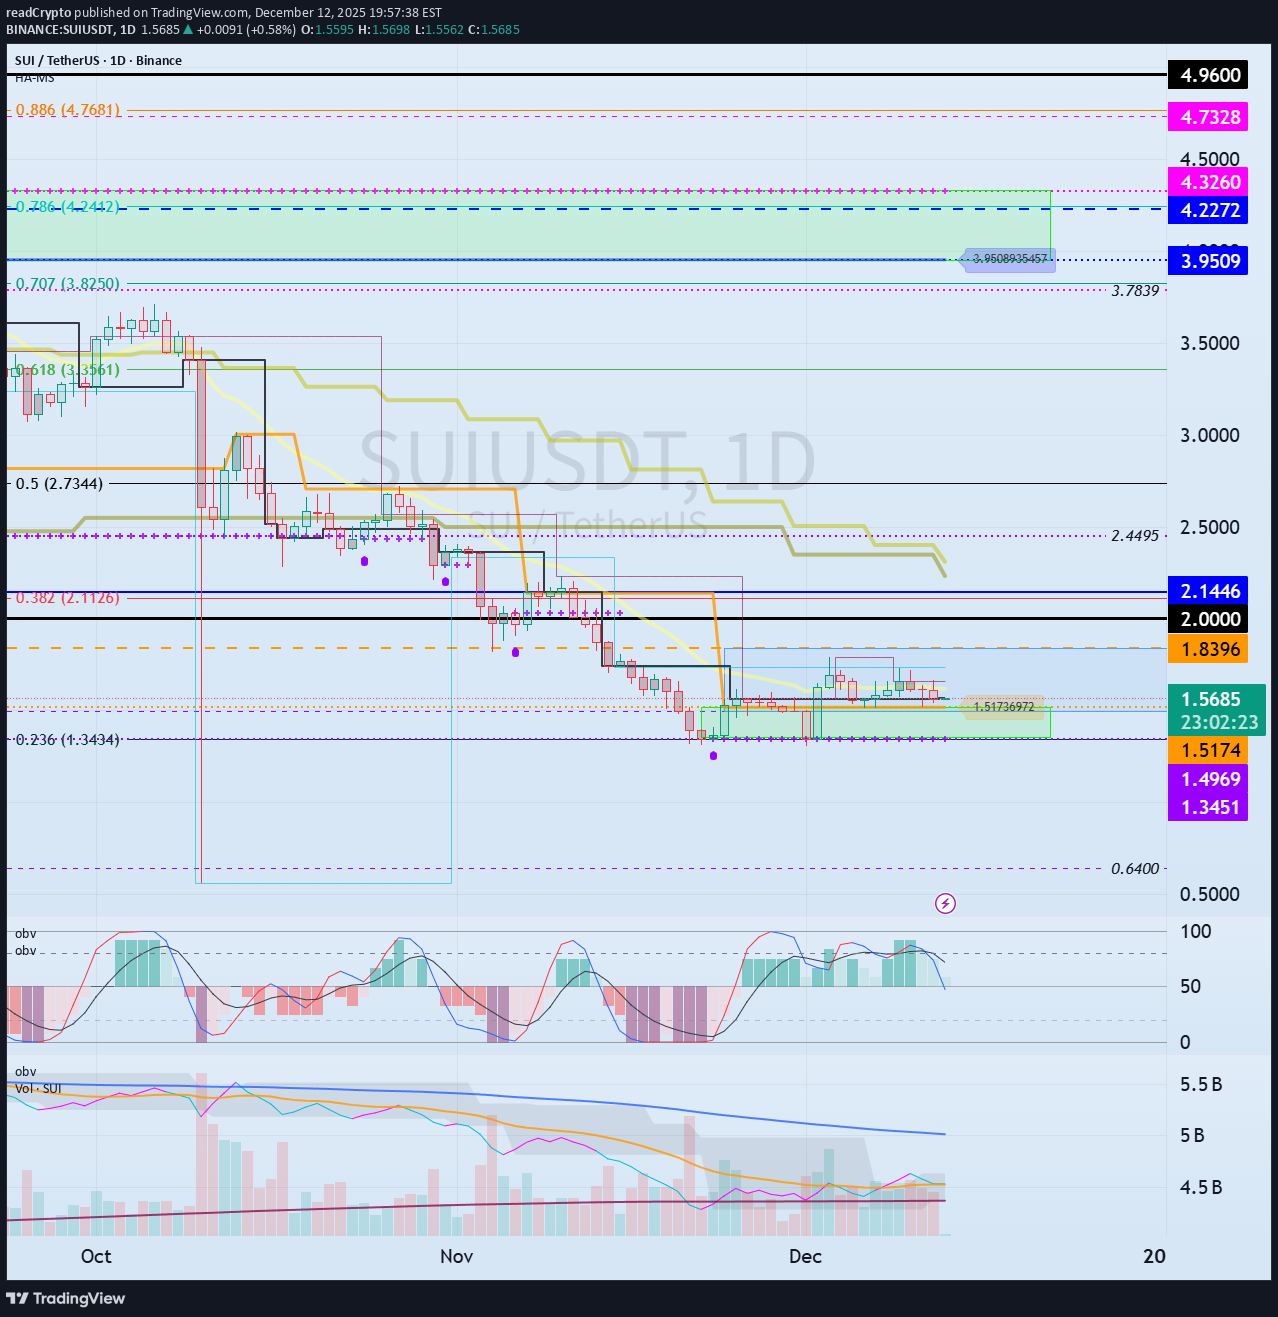
Hello, traders! Follow us to get the latest information quickly. Have a great day! ------------------------------------- (SUIUSDT 1M chart) To continue the uptrend, the price must rise above the M-Signal indicator on the 1M chart and hold. Accordingly, the key question is whether the price can rise above the 2.0-2.1446 range and maintain its upward momentum. If the upward movement fails, we should observe whether the M-Signal indicator on the 1M chart moves sideways until it declines near the Fibonacci level of 0.236 (1.3434). - (1W chart) The key question is whether the price can find support and rise near the newly forming DOM (-60) ~ HA-Low range (1.4969-1.8396). Based on the basic trading strategy, the target range is around the 4.2272-4.7328 range. However, caution is advised when trading, as the price is currently forming below the M-Signal indicator on the 1M chart. Therefore, I think it's best to start trading after confirming whether the price rises to around 2.0-2.1446 and maintains its strength. - (1D Chart) When analyzing charts, it's best to observe the movements of the 1D chart as a basic trading strategy. This is because most indicators are derived from the 1D chart. In this sense, the key is whether the price can find support and rise around the 1.3451-1.5174 range, which is the DOM(-60) ~ HA-Low range on the 1D chart. As mentioned earlier, to sustain the uptrend from a long-term perspective, the price must remain above the M-Signal indicator on the 1M chart. Therefore, the current price level is not suitable for trading. A decline in the DOM(-60) ~ HA-Low range could lead to a step-down trend. This means that the price is renewing its low, but it can also be considered a time for a split buy. Therefore, you should consider how to execute a split buy before starting a trade. If the price rises from the DOM(-60) to HA-Low range, the HA-High to DOM(60) range will form. Therefore, if you bought near the DOM(-60) to HA-Low range, you should sell near the HA-High to DOM(60) range. However, if the price rises from the HA-High to DOM(60) range, it's likely to form a step-up trend, so it's recommended to sell in steps. As mentioned earlier, a step-up trend, like a step-down trend, means that the price is renewing its high. Therefore, since a sharp decline is possible at any time, it's advisable to sell in steps at the appropriate time to secure profits. - In summary, if you encounter the DOM(-60) or HA-Low indicators, you should focus on finding the right time to buy and consider how to execute the split purchase. Furthermore, if you encounter the DOM(60) or HA-High indicators, you should focus on finding the right time to sell and consider how to execute the split purchase. This is the basic trading strategy. If not, and you buy when the HA-High ~ DOM(60) range supports and rises, or sell when the DOM(-60) ~ HA-Low range resists and falls, it's best to maintain your stop loss. - Thank you for reading to the end. I wish you successful trading. --------------------------------------------------