Technical analysis by RexTraderSignal about Symbol BTC: Sell recommendation (12/12/2025)

Bitcoin Rejected at Supply
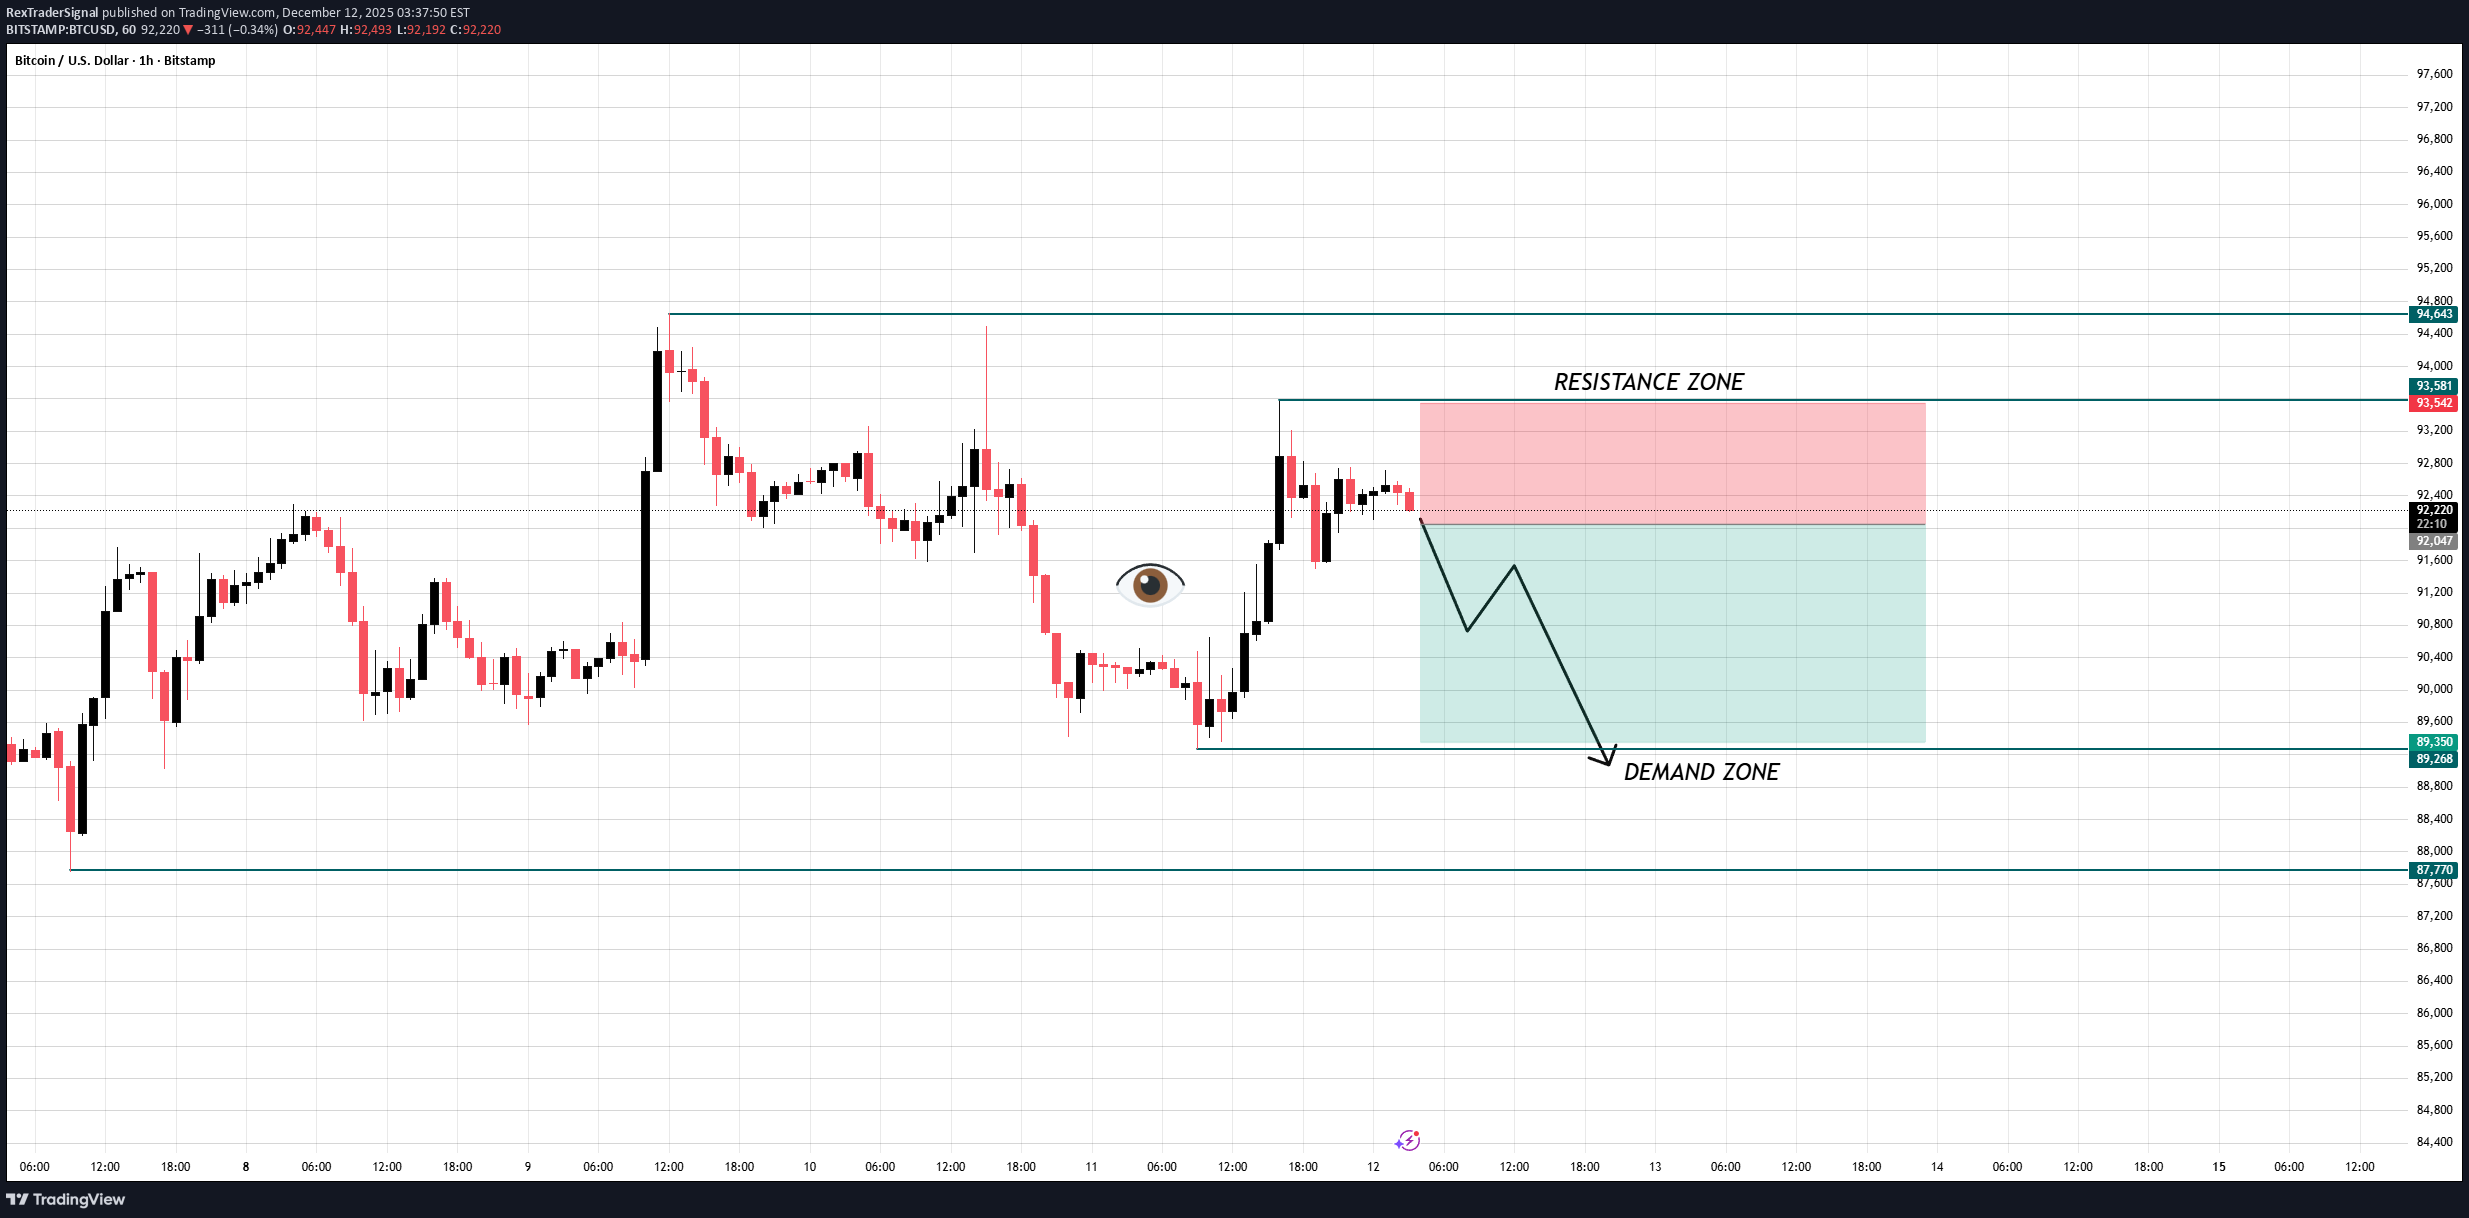
1. MARKET CONTEXT Bitcoin on the 1H timeframe has just tapped into a clear resistance / supply zone, where previous bearish impulses originated. The reaction is identical: - Immediate slowdown - Loss of bullish momentum - Selling pressure absorbing every attempt to push higher This confirms the market is still range-bound, with liquidity building between supply above and demand below. 2 . TECHNICAL ANALYSIS The chart structure highlights: • Supply Zone Rejection Price entered the resistance zone and instantly stalled — showing strong sell orders waiting in that area. • Lower-Timeframe Shift The current candlestick sequence shows a micro shift from bullish impulse → correction → bearish intent. • Liquidity & Imbalance Below There is an unfilled region between current price and the demand zone, creating a clean path for the market to drop. • Demand Zone Waiting at 89,300 – 87,770 This is where previous strong buy orders originated, making it the most logical target for the next bearish leg. Overall, the structure favors a continuation downwards after a small corrective pullback. 3. TRADE IDEA Bias: Short from the Supply Zone The entry is positioned inside the resistance zone, aligning with institutional sell reaction. Expected Price Behavior: Minor bullish correction Bearish continuation Price targets the Demand Zone at 89,300 – 87,770 Trade Structure Shown on Chart: Stop Loss: Above the supply zone Entry: At resistance rejection Take Profit: Demand zone below This setup follows clean smart-money flow from supply → demand, with no structural break supporting a bullish reversal yet.BTCUSD Update — TP1 Hit, Market Shifts into Temporary Sideways Mode BTCUSD reached TP1 as projected, then pulled back and transitioned into a short-term sideways range. This behavior is technically healthy and aligns well with current macro conditions. Yesterday’s decline was largely driven by risk-off sentiment, as markets reacted to macro uncertainty, profit-taking after recent gains, and positioning ahead of key economic expectations. That move flushed short-term liquidity and weak hands from the market. Now, with that downside pressure already absorbed, BTC is stabilizing. Price is ranging as traders reassess macro signals particularly expectations around future Fed policy, liquidity conditions, and broader risk sentiment. In short: The drop completed its objective (TP1) Sellers are losing momentum Buyers are defending key zones The market is pausing, not reversing This sideways phase is likely a re-accumulation period, allowing BTC to build liquidity before the next directional move once a new macro catalyst appears.BTCUSD Update — Demand Zone Respected, Re-Accumulation Underway 1. Technical Read — What the Chart Confirms Now Price was rejected from the resistance zone (~93,500), triggering a controlled pullback. The drop completed a liquidity sweep below prior lows, shaking out late longs. BTC has now reclaimed the 89,300–89,500 level, signaling demand absorption. The current structure suggests range re-accumulation, not continuation lower. As long as price holds above the 87,700 demand base, the downside is structurally limited. 2. Macro Context — Why BTC Is Stabilizing The corrective move aligns with short-term macro pressure, not bearish regime change: Risk-off flows emerged after recent macro headlines, leading to profit-taking across high-beta assets. USD and yields stabilized temporarily, pausing BTC’s upside momentum. However, Fed expectations remain dovish into 2025, keeping medium-term liquidity supportive. Spot ETF demand continues to absorb dips, preventing deeper breakdowns. This explains why selling pressure faded quickly once liquidity was taken. 3. Updated Scenario — What Comes Next Primary Scenario (Higher Probability) Short-term consolidation above 89,000 Minor pullbacks to build liquidity Break back above 91,500–92,000 Retest of the 93,500 resistance zone Continuation Scenario If BTC clears 93,500 with volume, the path opens toward 94,600 → 95,000, as marked on your chart. Invalidation Only a sustained break below 87,700 would weaken the bullish structure.