Technical analysis by readCrypto about Symbol BTC on 12/10/2025

readCrypto
Next Volatility Period: Around December 23rd
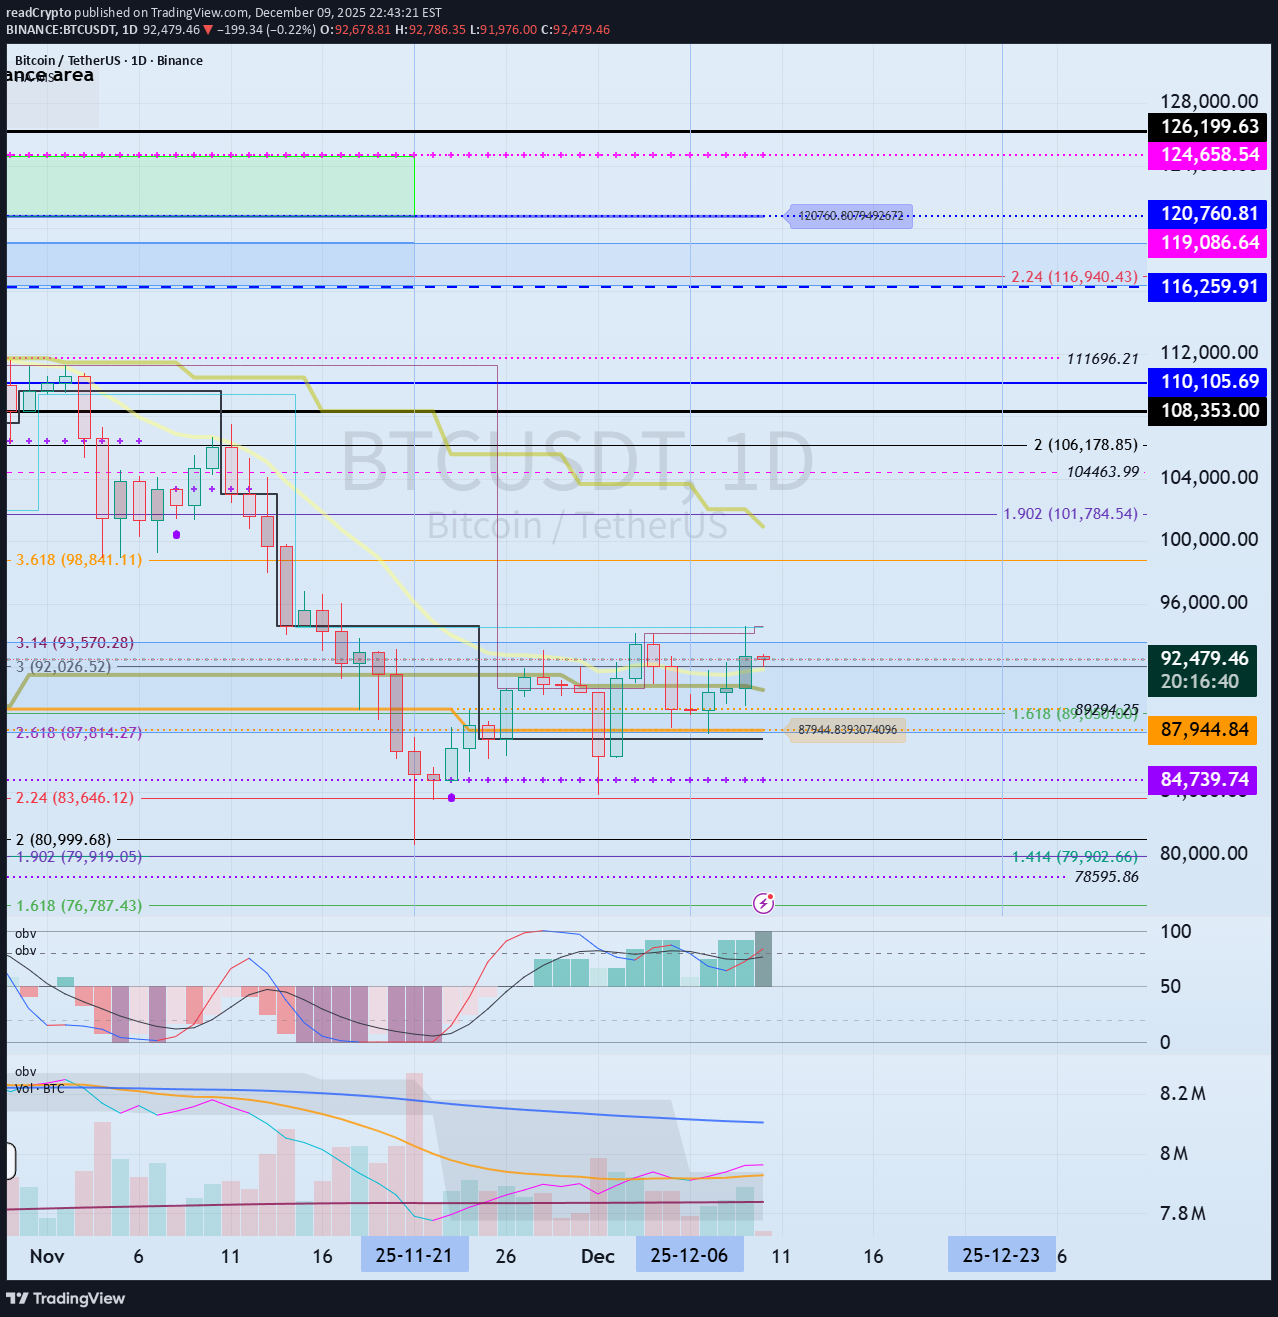
Hello, fellow traders! Follow us to get the latest updates quickly. Have a great day! ------------------------------------- #BTCUSDT To initiate a bullish trend, the price must rise above and sustain the OBV Low indicator level. Considering the basic trading strategy of buying around DOM(-60) ~ HA-Low and selling around HA-High ~ DOM(60), the current price position represents a buying opportunity. However, if the price falls between DOM(-60) and HA-Low, a stepwise downward trend is likely, so you should consider a response plan. If the price falls below the DOM(-60) indicator, you should check for support around the 69000-73499.86 level. This is because the 69000-73499.86 level represents an important support and resistance zone for sustaining an uptrend from a long-term perspective. If the price declines from the 69,000-73,499.86 range, it is expected to form an uptrend around 42,000, a level never seen again. - If the price rises above the OBV Low indicator level and continues its upward trend, we should check for an upward breakout near the area circled on the chart. If the price fails to break out, we should consider a response plan, as this could signal a full-blown bear market. If the price continues to rise, the target levels are: - Right Fibonacci ratio 2.618 (133,889.92) - Right Fibonacci ratio 3 (151,018.77) ~ 3.14 (157,296.36) It is expected to re-establish the trend by rising near the above range. The coin market is likely to experience a major bear market around the week of January 26, 2026. - Thank you for reading. I wish you successful trading. -------------------------------------------------- - Here's an explanation of the big picture. (3-year bull market, 1-year bear market pattern) I will explain more in detail when the bear market begins. ------------------------------------------------------