Technical analysis by GoldMasterTrades about Symbol ETH on 12/7/2025

GoldMasterTrades
تحلیل اتریوم: شکست اولیه در این محدوده قطعا جعلی خواهد بود!
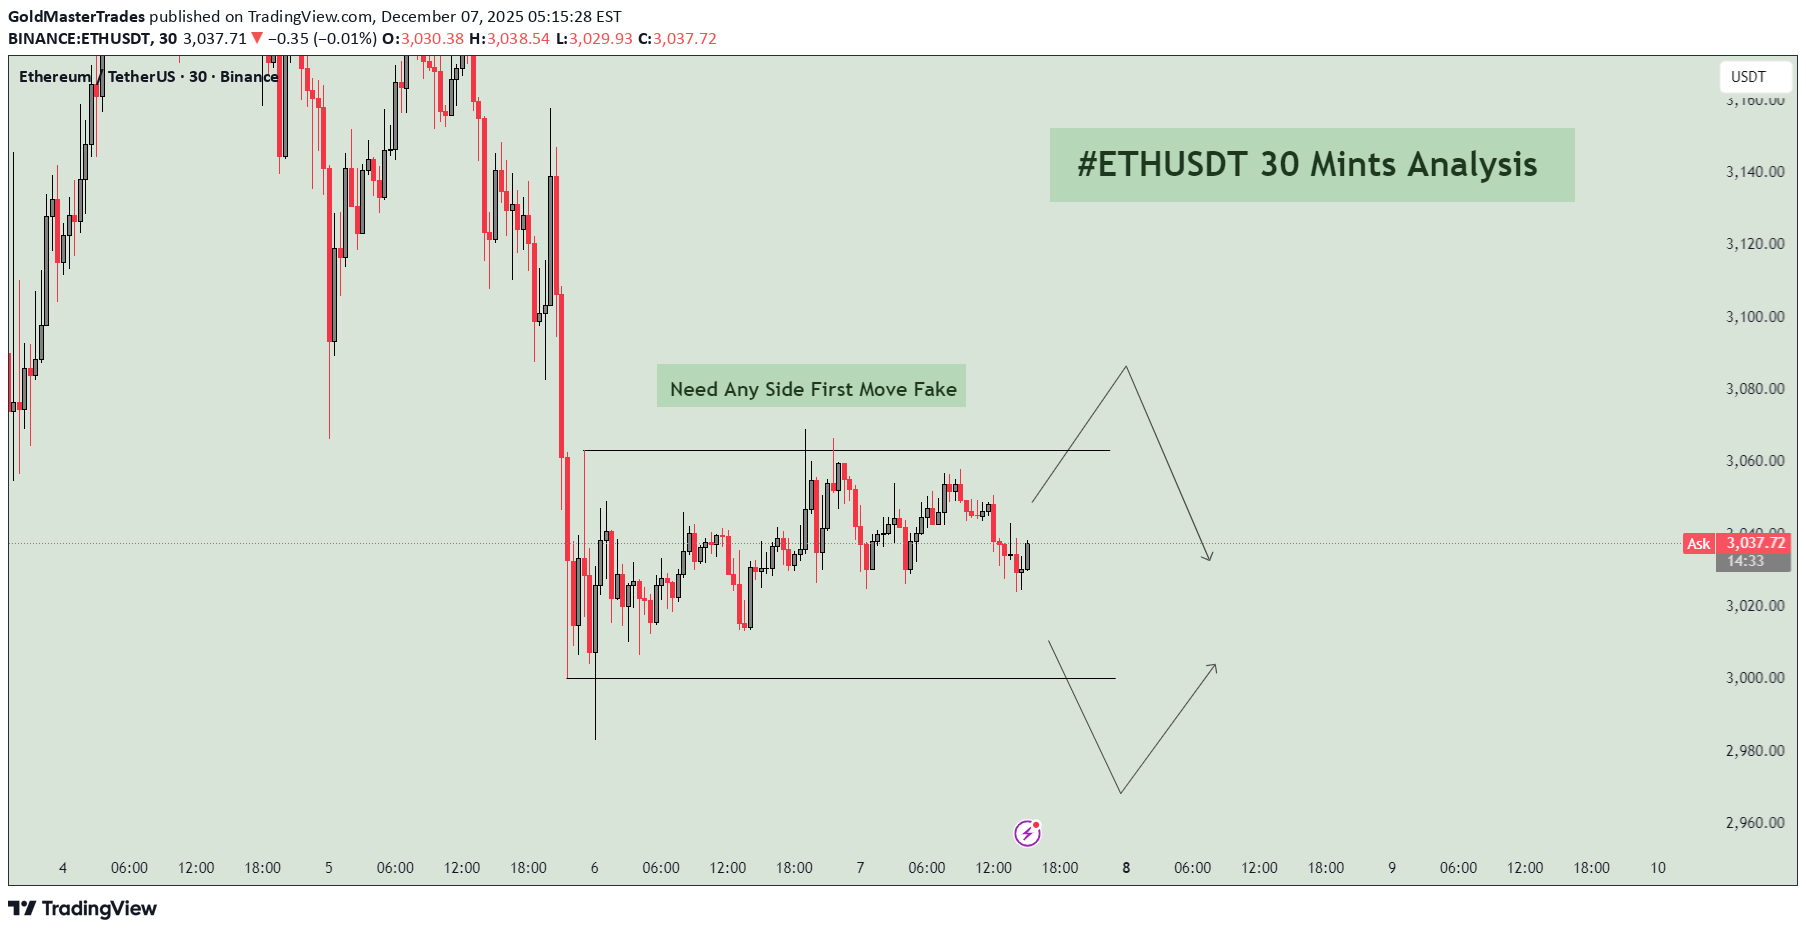
📌 Chart Overview This ETH/USDT 30-minute chart shows a consolidation phase after a strong drop. Price is moving inside a clear sideways range, building liquidity on both sides. The idea on the chart focuses on waiting for a fake breakout (liquidity sweep) before the true move begins. 📍 Market Structure Price is trapped between a defined upper resistance and lower support. Multiple touches on both sides show that buyers and sellers are accumulating orders. This creates equal highs and equal lows, which is where liquidity naturally forms. The chart highlights that the market is not ready for a clean breakout yet. Instead, it is preparing to trap traders on one side. 📍 Upper Liquidity Zone The resistance line above the range is a major level. Price has rejected it many times, which means: breakout traders will try to buy above it stop-losses of short positions are sitting there smart-money will aim to grab liquidity above it A breakout above this level is expected to be fake first, meaning price may spike above but quickly reverse downward. 📍 Lower Liquidity Zone The support line under the range is equally important. Several wick rejections show buyers defending this level, which means: long stop-losses are below sell-side liquidity is growing institutions may “run the lows” before pushing up A drop below this support is also expected to be fake, followed by a reversal upward. 📍 Fake Move Logic The chart’s message “Need Any Side First Move Fake” means: Do not trust the first breakout The market will likely sweep liquidity on one side The real direction usually comes opposite to the first breakout This is a classic Smart Money / Liquidity Grab pattern. 📍 Scenario: Fake Break Up → Real Drop If price breaks above resistance: breakout buyers enter liquidity is taken price rejects the top strong downward move begins This is a buy-side liquidity sweep leading to a bearish move. 📍 Scenario: Fake Break Down → Real Pump If price breaks below support: longs get liquidated liquidity collected price reverses and pushes upward This is a sell-side liquidity sweep leading to a bullish move.