Technical analysis by GoldMasterTrades about Symbol XRP: Sell recommendation (12/7/2025)

GoldMasterTrades
تحلیل XRP/USDT: سقوط نهایی به نقدینگی زیر ۱.۲۰ دلار پیش از جهش بزرگ ۲۰۲۶!
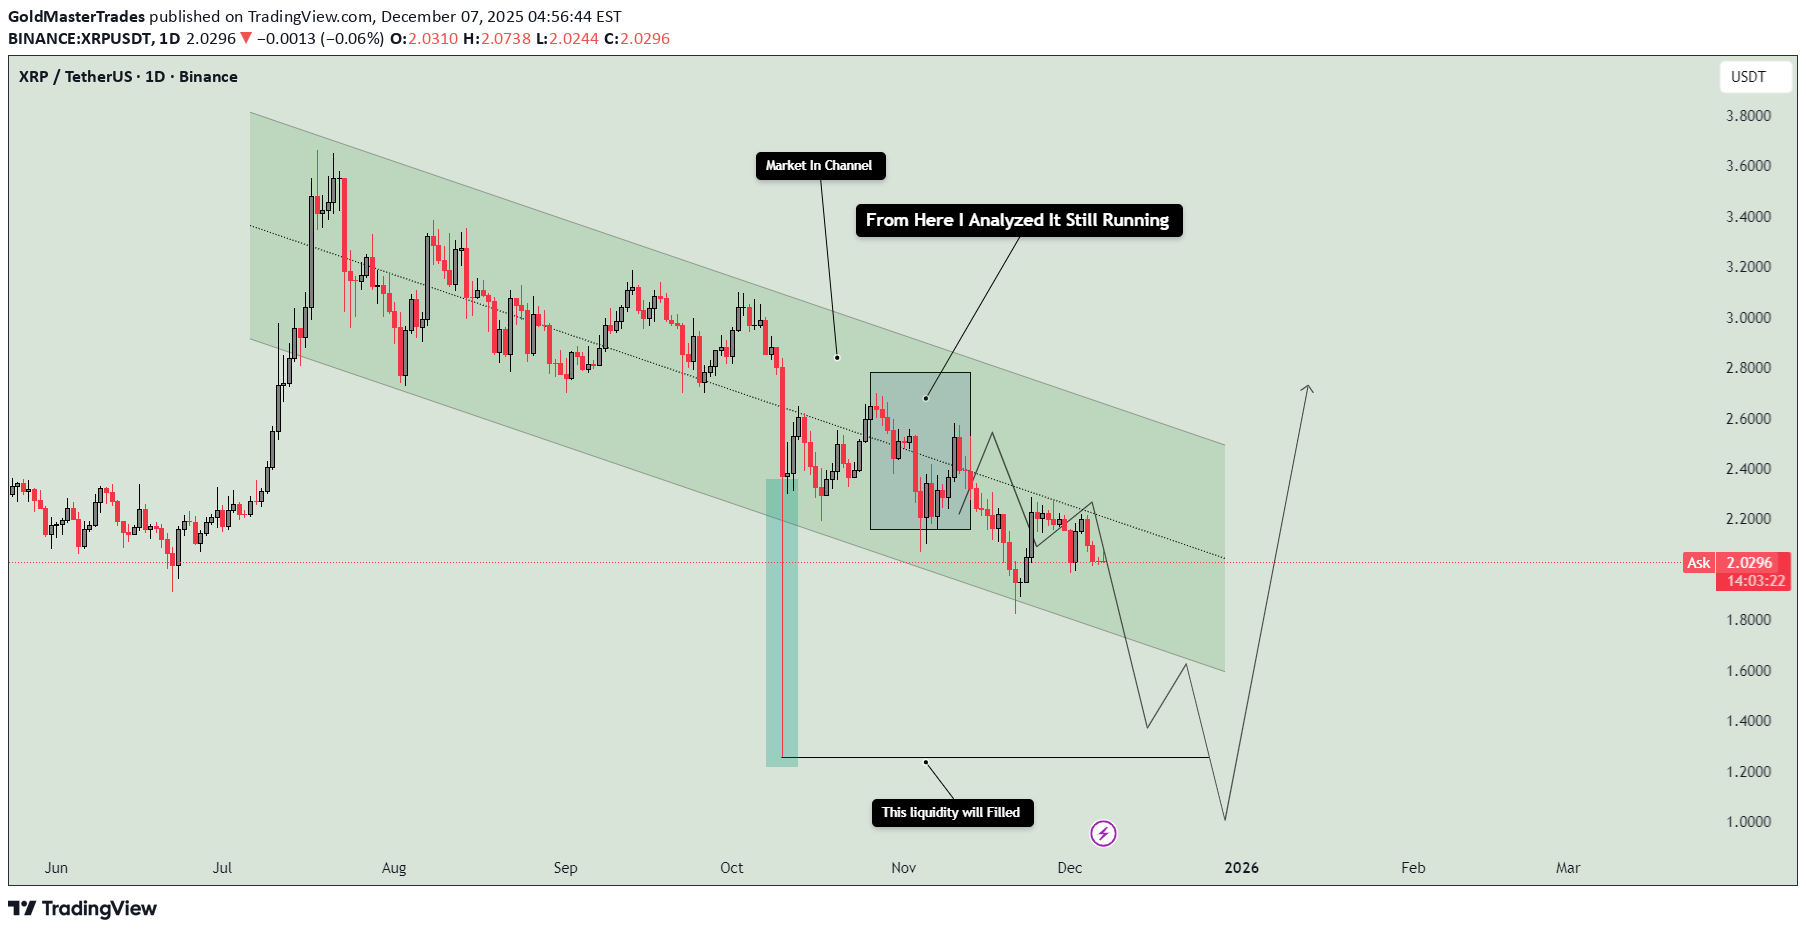
🐻 Bearish Channel Confirmation The most prominent feature is the downward channel (the green shaded area) that has been containing the price action since the major high in July/August. The Trend: The market has been making lower highs and lower lows, confirming a strong downtrend. Channel Respect: The price bars (candles) consistently bounce off the channel's upper and lower boundaries, indicating that traders are respecting this structure. Continuation: The note "Market is in Channel" and "From Here I Analyzed It Still Running" confirms the analyst's belief that the downtrend is likely to continue in the near term, keeping the price contained within the green parallel lines. 💧 The Liquidity Magnet A key part of the current analysis is the expectation of the price reaching a specific low point, often referred to as a liquidity zone or demand zone. Target: The chart specifically marks a horizontal line around the $1.20 - $1.00 area with the note: "This liquidity will [be] filled." Analyst’s Logic: In technical analysis, large market orders often sit below prior significant lows (a 'liquidity pool'). The analyst anticipates that the final phase of this downtrend will be a sharp move down (liquidity grab) to trigger these sell orders and fill the demand from institutions or "smart money." 🚀 The Projected Reversal: Heading into 2026 The analysis outlines a distinct two-stage prediction for the future price action: a final drop followed by a massive surge. Stage 1 (Final Drop): The projected path shows the price breaking out of the channel to the downside and plunging towards the marked liquidity zone (around $1.00-$1.20) in late December or early 2026. This completes the bearish structure. Stage 2 (The Bounce): Immediately after filling the liquidity, the chart projects a sharp reversal and an aggressive move upward, forming a large V-shaped recovery. The arrow indicates a significant potential rally, suggesting the start of a new, long-term bullish trend that could break the previous highs. 💡 Content Points for the Minds Section For a more detailed explanation on Minds, you can expand on the following concepts: Downtrend Structure: Explain that the bearish channel defines the current macro-trend. Until the price breaks convincingly above the channel's upper boundary, the overall direction remains down. Why Liquidity is Key: Discuss the concept of "selling to the buyers." A deep wick or move to the $1.00-$1.20 area is necessary to clear out weak hands, trigger stop losses, and allow large players to accumulate at a discount before the rally begins. The Timeframe: Stress that this is a long-term (1D chart) analysis. The expected moves will take weeks or months to fully materialize, especially the final bullish push into 2026. Confirmation Signals: What would invalidate the analysis? If the price breaks above the top of the channel before hitting the liquidity zone, the bearish move would be cancelled. What confirms it? A sharp spike down to the $1.00 area followed by an immediate, strong candle close back up.