Technical analysis by CryptoNuclear about Symbol FET: Buy recommendation (12/6/2025)

CryptoNuclear
منطقه سرنوشتساز FET/USDT: آیا قیمت در محدوده ۰.۱۴ تا ۰.۲۱ نگه میدارد یا سقوط میکند؟
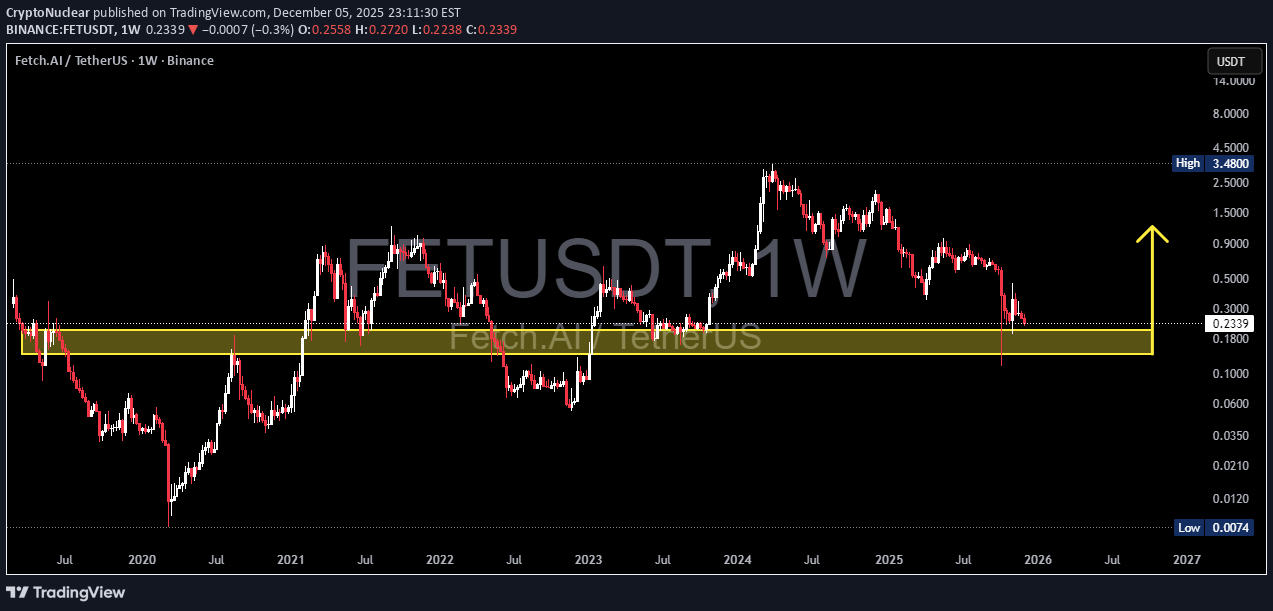
The FET/USDT weekly chart is revisiting one of the most historically significant zones in its entire price history — the 0.21–0.14 demand block. This zone is not just a support area. It has consistently acted as the boundary between Accumulation and Capitulation since 2019. Every major FET rally began only after this zone was defended. And now, price has returned to this zone once again — making this a major decision point for the next macro trend. --- Why This Zone Matters The 0.21–0.14 range served as the structural base for the powerful rallies in 2020, 2021, and the AI-driven surge in 2024. The sharp downside wick below the zone followed by a fast recovery suggests a liquidity grab, hinting that larger players may still be accumulating here. Price action is forming a compression pattern, a structure that typically precedes explosive breakouts — either up or down. This is a point where the market rarely stays quiet for long. --- Technical Structure & Pattern FET has formed Lower Highs since the 2024 peak → medium-term downtrend still intact. But price reactions within 0.21–0.14 remain strong, indicating an early-stage reaccumulation pattern. The wick sweep below the zone resembles a potential Wyckoff Spring, not yet confirmed but clearly visible. In simple terms: If this zone holds, a long-term reversal can begin. If it fails, the chart opens the door to a new bearish leg. --- Bullish Scenario 🔵 1. Demand Holds: “Buyers Take Control” If the weekly candle closes above 0.21–0.18, it signals that buyers are still defending this historical demand block. A stronger confirmation appears once price reclaims 0.30, the nearest structural resistance. ➡️ Bullish Targets: 0.30 → short-term confirmation 0.50 – 0.60 → mid-range resistance 0.90 – 1.50 → major recovery zone 2.50 – 3.40 → full cycle retracement if the AI narrative reignites This would frame the 0.21–0.14 zone as a macro reaccumulation base before the next expansion phase. --- Bearish Scenario 🔴 1. Clean Breakdown: “Demand Fails” A weekly close below 0.14 would invalidate the entire multi-year structure. If that happens: the demand block collapses, bearish continuation becomes highly likely, and the chart enters a deeper macro range. ➡️ Bearish Targets: 0.10 – 0.07 → historical liquidity zone from 2019–2020 Further downside becomes possible if momentum accelerates A breakdown below 0.14 would turn FET into a completely new market structure. --- Key Insight FET is currently sitting on a zone that has defined every major trend shift for the past 5 years. The next weekly closes will determine whether we are entering: a Phase B Accumulation → new macro rally, or a structural breakdown → multi-month bearish continuation. This is the calm before a major move — and the 0.21–0.14 zone remains the battlefield. --- #FETUSDT #FetchAI #CryptoAnalysis #KeyLevel #DecisionPoint #WeeklyChart #CryptoTA #SupportZone #Wyckoff #SmartMoneyConcepts #AINarrative