Technical analysis by BlackBull Markets about Symbol BTC on 12/2/2025

پیشبینی حرکت بعدی بیت کوین: تحلیل 4 تایمفریم، آیا زمان برگشت فرا رسیده است؟
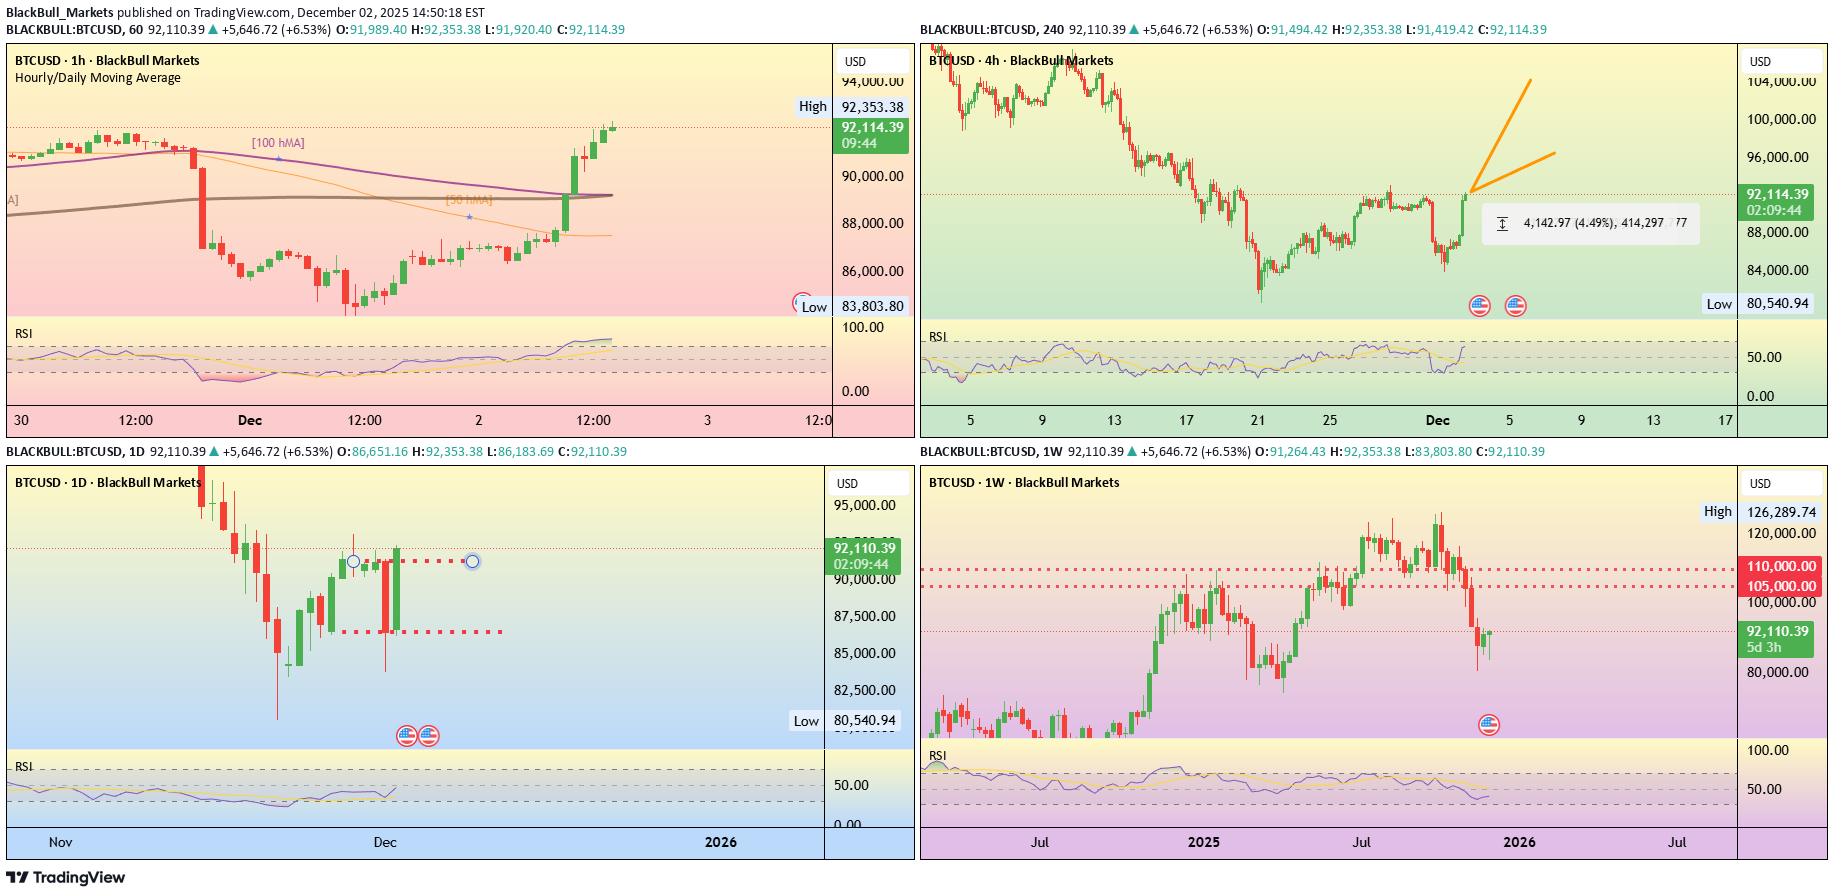
Weekly A sustained move through the key resistance on this timeframe at105,000 to 110,000, could confirm a reversal. For now, the weekly outlook shows a potential market in correction rather than reversal. Daily After dropping nearly 5% yesterday, Bitcoin has rebounded sharply today with a gain of about 6.7%. The price is currently up $5775 at $92,060. Today’s low at $86,190 followed yesterday’s deeper dip to $83,814. The daily chart may suggest further upside potential. 4H Momentum on RSI has turned higher on the 4-hour chart, lifting from oversold conditions and breaking back above the midline. This suggests improving intraday demand and provides a base for further upside if price continues to hold above the recent breakout level. The next resistance sits around 96,500, the prior swing high on this timeframe. 1H The hourly timeframe shows the price bouncing back above the 50, 100 and 200-hour moving averages, which are currently clustered around $87,500 and $89,320. If the price stays above these converged moving averages, it can signal continued buying pressure in the near term.