Technical analysis by GoldMasterTrades about Symbol TON: Sell recommendation (12/2/2025)

GoldMasterTrades
سقوط قریبالوقوع تون کوین (TON/USDT): هدف بعدی کجاست؟
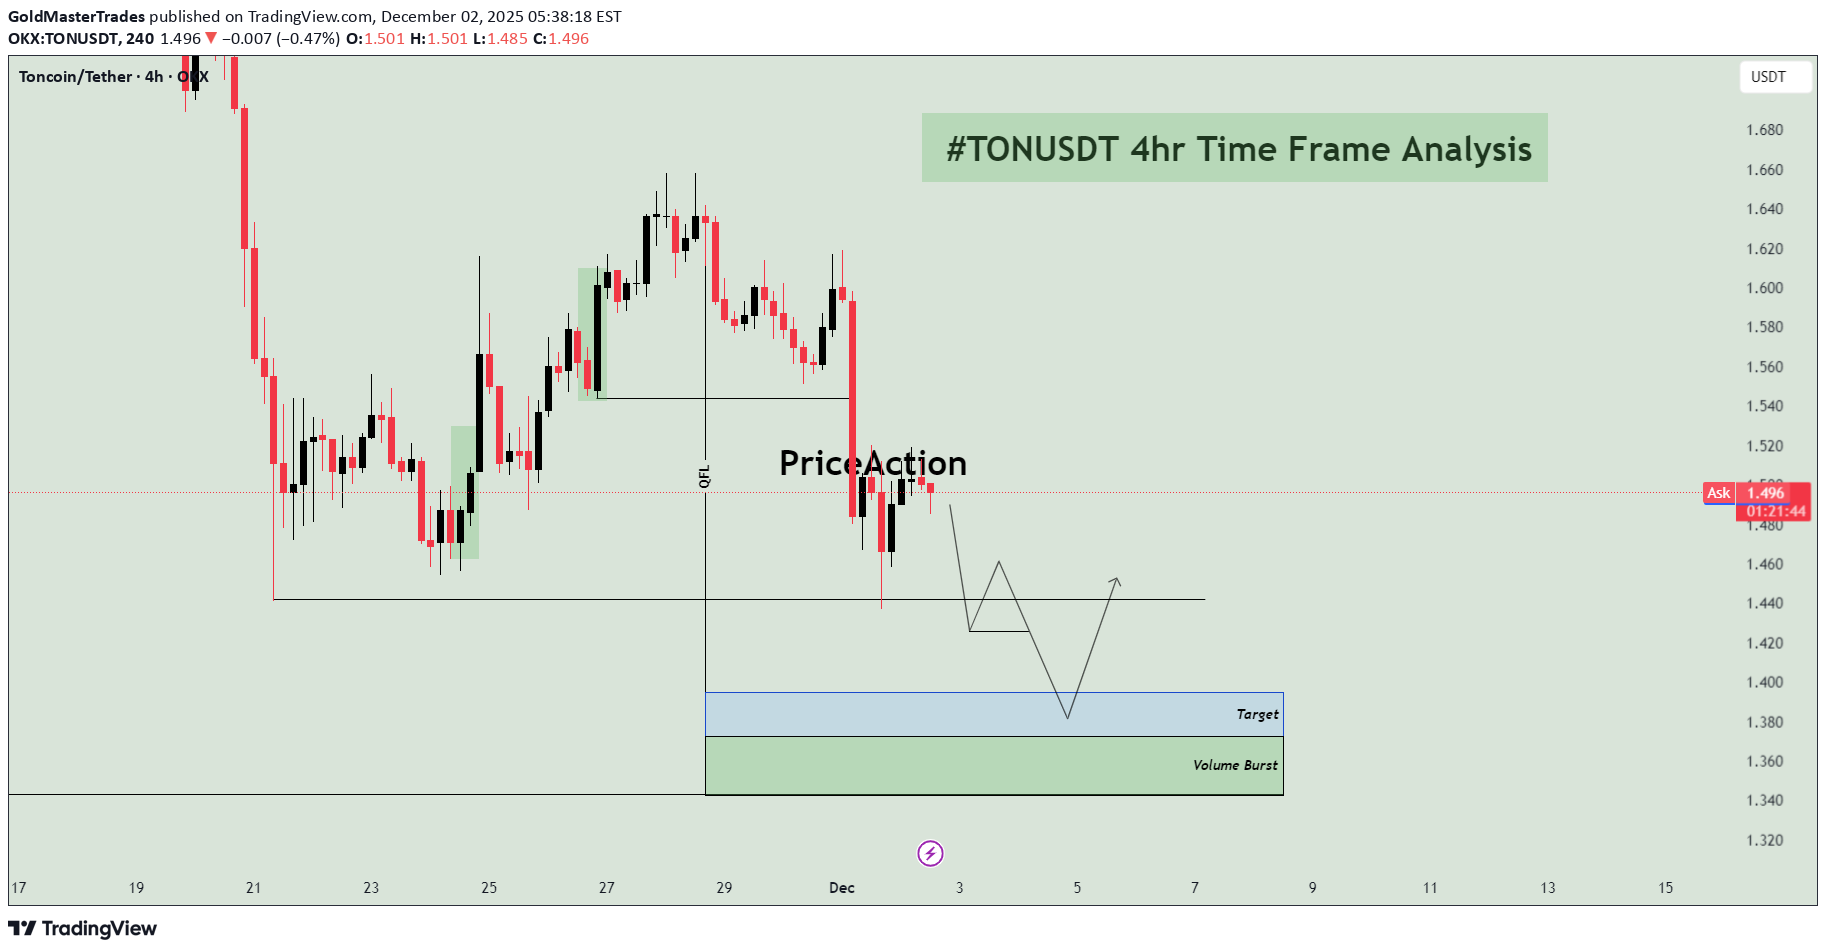
📉 TON/USDT 4H: Anticipating Continuation Short Towards Unmitigated Demand 📝 Market Overview and Structural Context The TON/USDT pair on the 4-hour chart is exhibiting a clear bearish structural shift. After a period of an attempt at a reversal (the recent small rally), the price has decisively broken below the most recent swing low, confirming that sellers are firmly in control. The price is currently consolidating just below a key structural point and is expected to continue its descent toward a significant Demand Zone that was the origin of a previous move higher. The overall hypothesis is a short continuation trade, targeting this fresh demand zone. 🔑 Key Technical Zones and Order Flow The analysis highlights the key structural break and the ultimate target zone: 1. Structural Break and Retest Level: The swing low around 1.550 was recently breached. Current Action: Price is now consolidating around the 1.480 - 1.500 area. The arrows on the chart suggest the expectation of a brief retest of the broken support level (around 1.460) before the bearish momentum continues. 2. Target and Volume Burst Zone (Demand) 🟢/🔵 Zone Location: This is the combined target area, spanning approximately 1.360 to 1.400. Significance: This area is a high-quality Demand Zone, identified as the "Volume Burst" zone. This area was the origin of the last significant bullish momentum (likely a Drop-Base-Rally structure) that launched the previous swing high. It represents the first major unmitigated area where institutional buy orders are expected to be located. The blue box, labeled "Target" (around 1.380 - 1.400), is the most immediate technical objective for the current short trade. The lower green box, "Volume Burst" (around 1.360 - 1.380), marks the distal boundary of the demand zone, providing the ideal area for the final take-profit and potential reversal. 3. Order Flow Level (OFL) Location: The price level around 1.560. Significance: This marks the origin of the last structural high before the move down. The structural breakdown confirms the selling pressure from this point. 📊 Trading Hypothesis: Short Continuation The trade plan anticipates a short continuation after a minor retest: Trade Direction: Short (Sell) Entry Strategy: The chart suggests waiting for a minor rally back toward the broken support level (around 1.460) to capture a more favorable entry price, minimizing risk. The short trade is initiated upon the rejection of this broken level. Stop Loss (S/L): The Stop Loss should be placed safely above the recent swing high that failed to break the prior structure (e.g., above 1.560 or the most recent significant high). Take Profit (T/P) 1: The Target (blue box) around 1.380 - 1.400. Take Profit (T/P) 2: The distal boundary of the Volume Burst zone around 1.360, which represents the maximum expected extension of the current move before a significant bounce occurs. ⚠️ Risk Management and Invalidation The risk lies in price reversing prematurely before reaching the target or failing to reject the retest level. Invalidation: A decisive move and close above the OFL level (1.560) would indicate renewed bullish momentum and invalidate the bearish structural thesis.