Technical analysis by DrForexPhd about Symbol BTC: Buy recommendation (11/27/2025)

بیت کوین حمایت را پس گرفت: آیا مسیر صعود به 94,000 دلار باز میشود؟
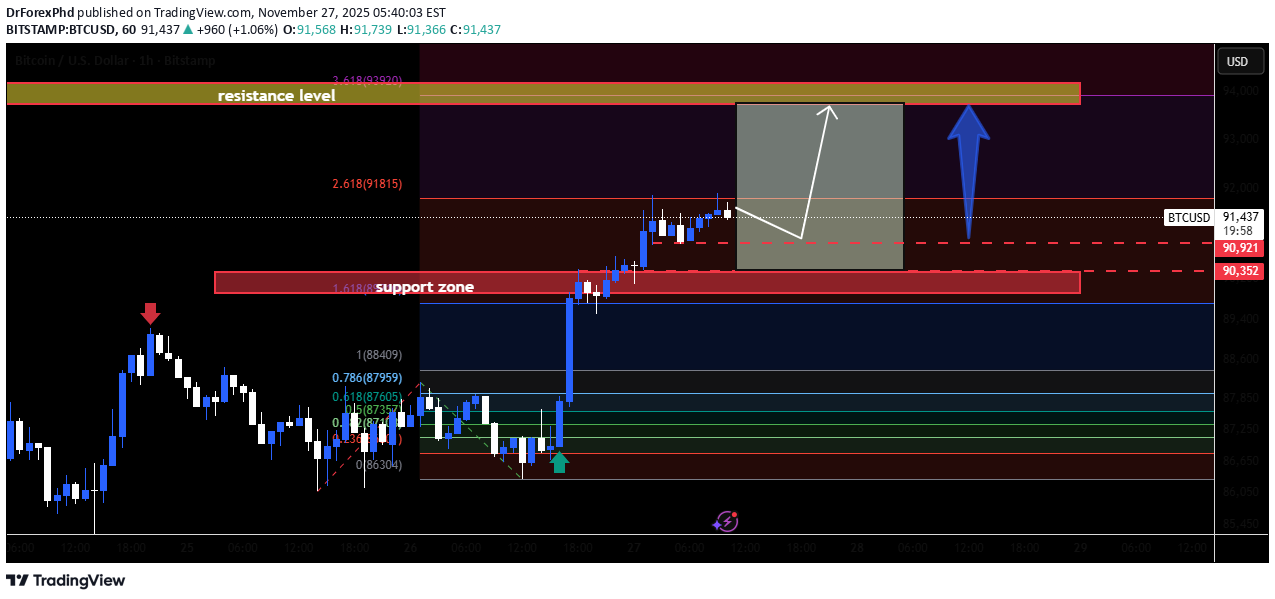
Chart Analysis 1. Key Support Zone (≈ 90,350 – 90,920) Your chart highlights a strong support zone where price previously reacted. Price has reclaimed this area, showing that buyers stepped in aggressively. This support aligns with Fibonacci retracement levels, strengthening its validity. 2. Current Price Structure BTC is consolidating just above support, forming a minor bullish structure. A higher-low formation is visible, suggesting buyers remain in control. The drawn white arrow also suggests an expected retest before continuation. 3. Local Resistance Cluster (≈ 92,500 – 94,000) The upper shaded zone marks a major resistance, possibly a supply region. This aligns with Fib extension levels (2.618–3.618). This is the area where sellers are likely to show up again. 4. Bullish Scenario (Most Probable Based on Chart) If BTC holds above 90,920, a rally toward the resistance zone is likely. The large grey projection box indicates a potential move to ~93,500–94,000. Momentum from the recent strong bullish candle also supports the upside. 5. Bearish Risk Scenario Losing 90,350 on strong volume could invalidate the bullish setup. If that happens, price may revisit 87,500–88,000 (Fib confluence).