Technical analysis by CryptoCoinsCoach about Symbol ETH on 11/26/2025

شکستن خط مهم RSI: آیا اتریوم آماده موج صعودی بعدی است؟
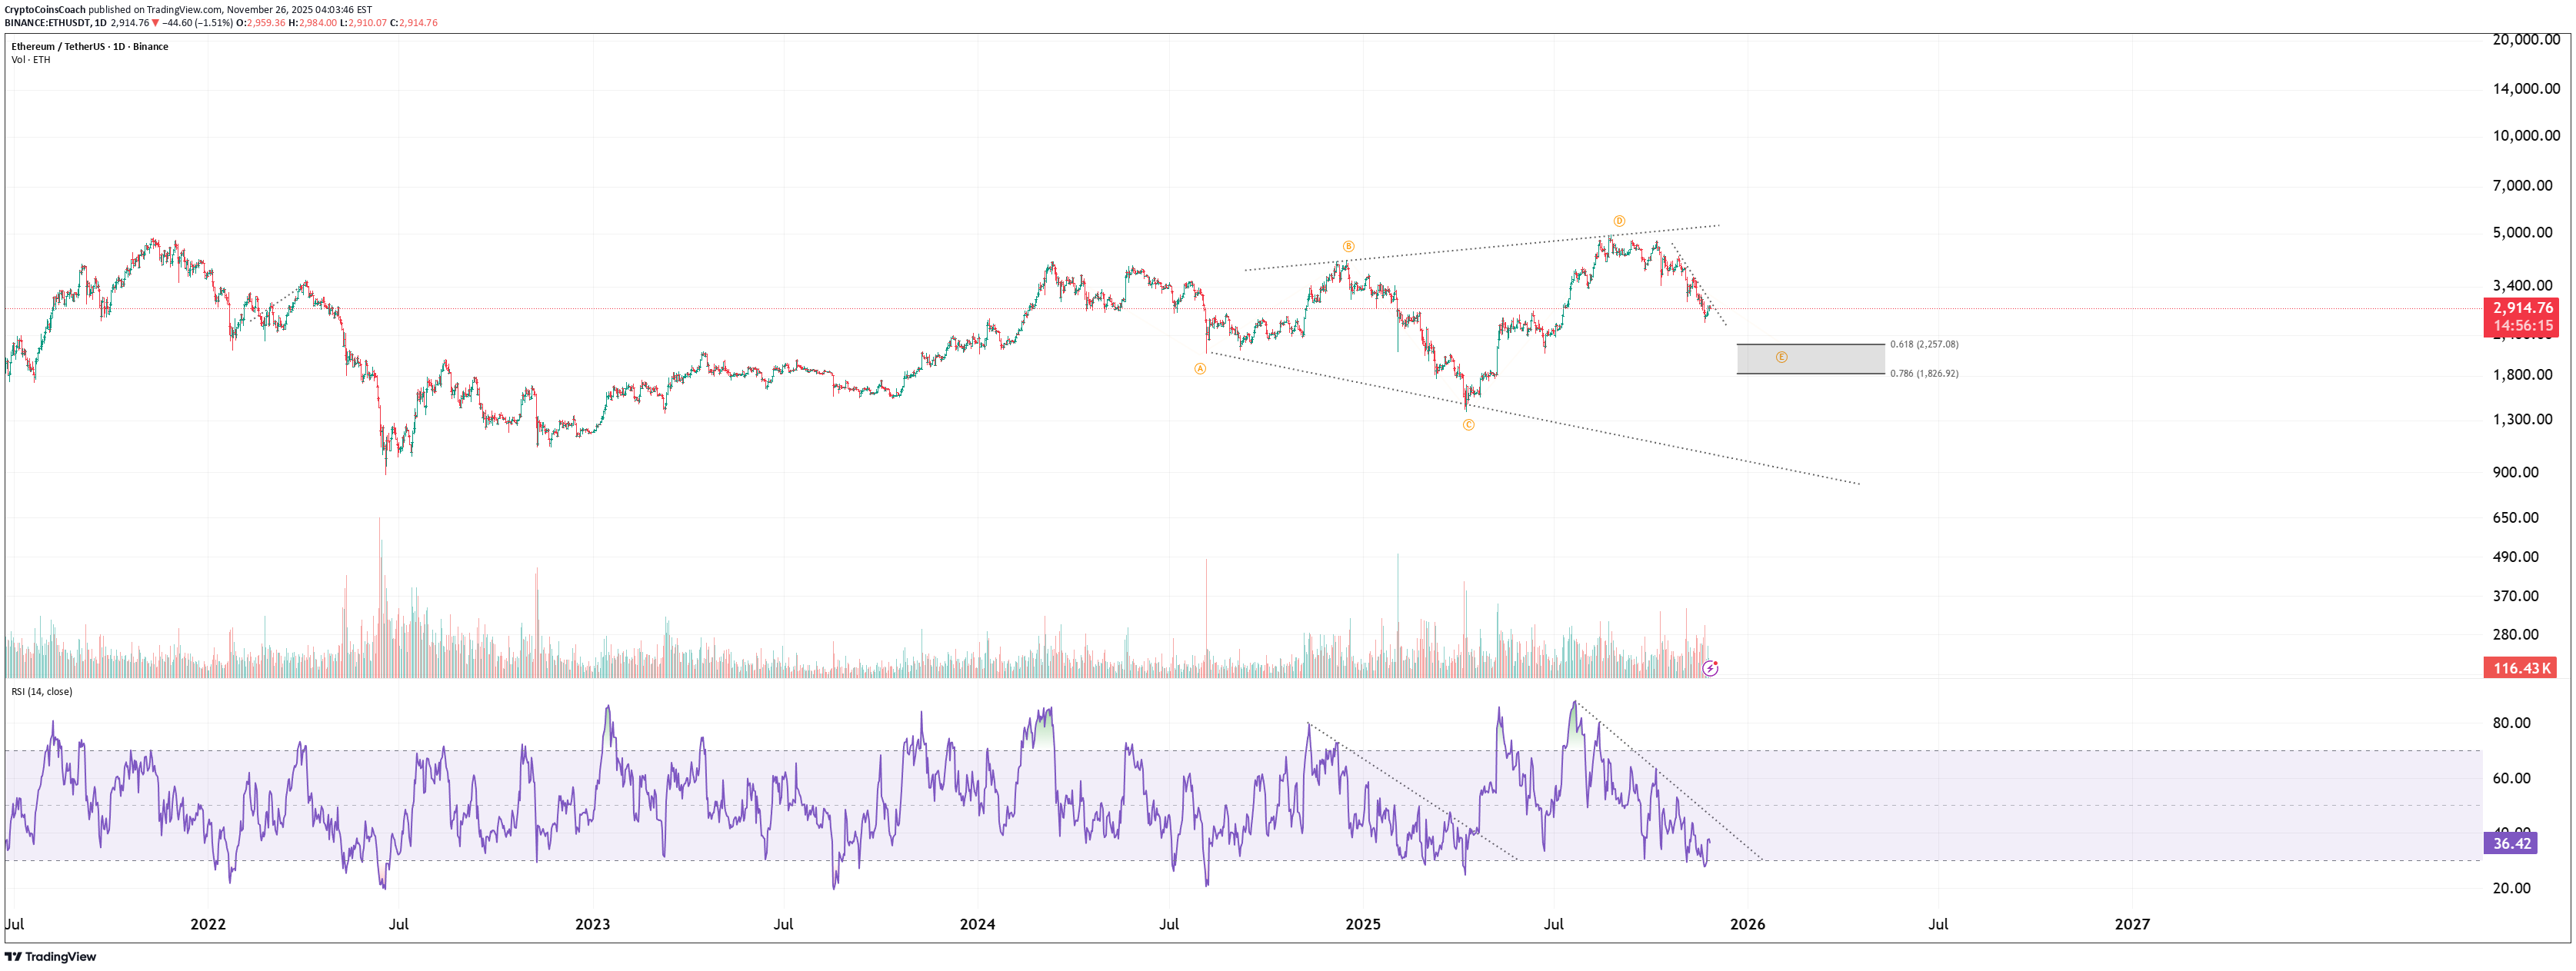
ETH is currently approaching a critical technical point, where price action and momentum are aligning for a potential shift. The chart shows price consolidating after a completed structure, while the RSI has been forming a clean descending resistance line for several months. The most important element here is the RSI structure . Each previous RSI breakout from a similar compression zone has led to strong directional movements. The current RSI position remains near oversold territory, and the descending trendline is now being tested once again. If momentum breaks through this level, it may act as the trigger for the next impulsive wave. Price is also hovering above the major Fibonacci supports , the 0.618 and 0.786 retracement levels , which historically act as high-probability reversal zones during corrective phases. This confluence between momentum and structural support creates a favourable environment for trend continuation if strength returns. Key Observations: • Price is sitting on strong higher-time-frame Fib support. • RSI is compressing under a long-term descending trendline. • Previous RSI breakouts have triggered impulsive legs. • Market structure suggests a potential setup for the next wave (upon confirmation). What to Watch: • A clean RSI breakout above the descending line. • Volume expansion supporting the move. • Price reclaiming short-term resistance to confirm momentum shift. In simple terms, ETH is preparing for its next major move, and the RSI breakout is the signal that can ignite the next wave. The setup remains valid as long as price continues to hold above the key Fib zone.