Technical analysis by readCrypto about Symbol ETH on 11/24/2025

آیا قیمت اتریوم بالای 2887.66 باقی میماند؟ کلید ادامه صعود کجاست؟
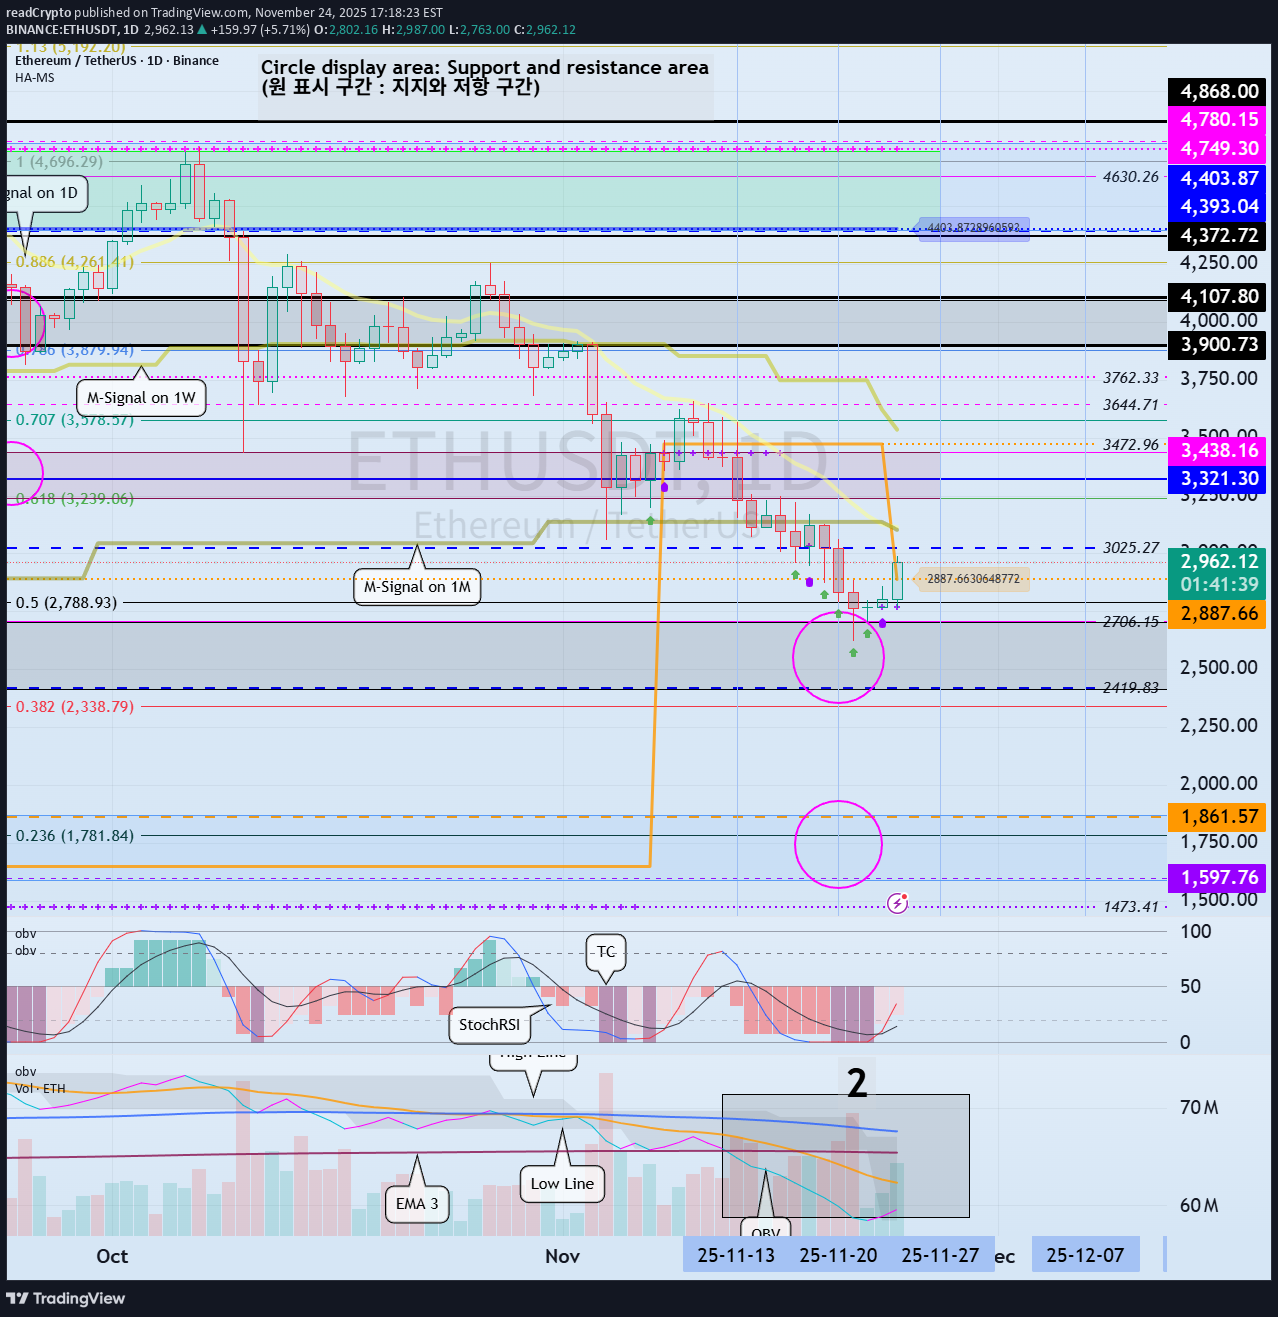
Hello, fellow traders. If you "Follow" me, you'll always receive the latest information quickly. Have a great day. ------------------------------------- (ETHUSDT 1D Chart) The HA-Low indicator on the 1D chart is showing signs of forming at 2887.66. Since the HA-Low indicator previously formed at 3472.96 and is showing signs of forming again, determining whether support at 2887.66 is crucial. Furthermore, since the indicator is located near the M-Signal indicator on the 1M chart, we need to see if the price can maintain its upward momentum above the M-Signal indicator on the 1M chart. In this sense, a rise above the previous HA-Low indicator level of 3472.96 is expected to trigger an uptrend. Therefore, to ensure that the uptrend continues after breaking above a key point or range, we need to monitor whether the StochRSI, TC, and OBV indicators remain in an upward trend. Since the OBV indicator has fallen below the EMA 3, it must rise above and remain above the EMA 3 level. We need to confirm whether the price can rise above the M-Signal indicator on the 1M chart after passing through this volatility period around November 27th (November 26th-28th). - Thank you for reading. We wish you successful trading. --------------------------------------------------#ETHUSDT Based on the current price level, the following key areas are important: - 4372.72-4868.0 - 3900.73-4107.80 - 3239.06-3438.16 - 2419.83-2706.15 There is a high possibility that the price will break above these levels and continue its upward trend. We will need to observe how the price moves as it passes through the next volatility period, around December 16th (December 15th-17th). To sustain the uptrend at these key points or areas, the StochRSI, TC, and OBV indicators must show upward trends. - The StochRSI indicator should ideally not enter an overbought zone. - The TC indicator should remain above zero. The OBV indicator should remain above the High Line. If it doesn't, there's a high chance it will pretend to rise but then fall, so caution is advised when trading. From this perspective, for the price to continue its upward trend by rising from the 3239.06-3438.16 range, a change in the StochRSI indicator's behavior is necessary. If the TC indicator touches its peak, the upward trend is likely to be constrained, so a change in the StochRSI indicator's behavior is also necessary. Therefore, support around the 3239.06-3438.16 range is crucial.