Technical analysis by ZareeFxTradingAac about Symbol BTC: Sell recommendation (11/24/2025)

ZareeFxTradingAac
تحلیل بیت کوین: فرصت شورت بعد از نفوذ نهایی به ناحیه ۸۹ هزار دلار!
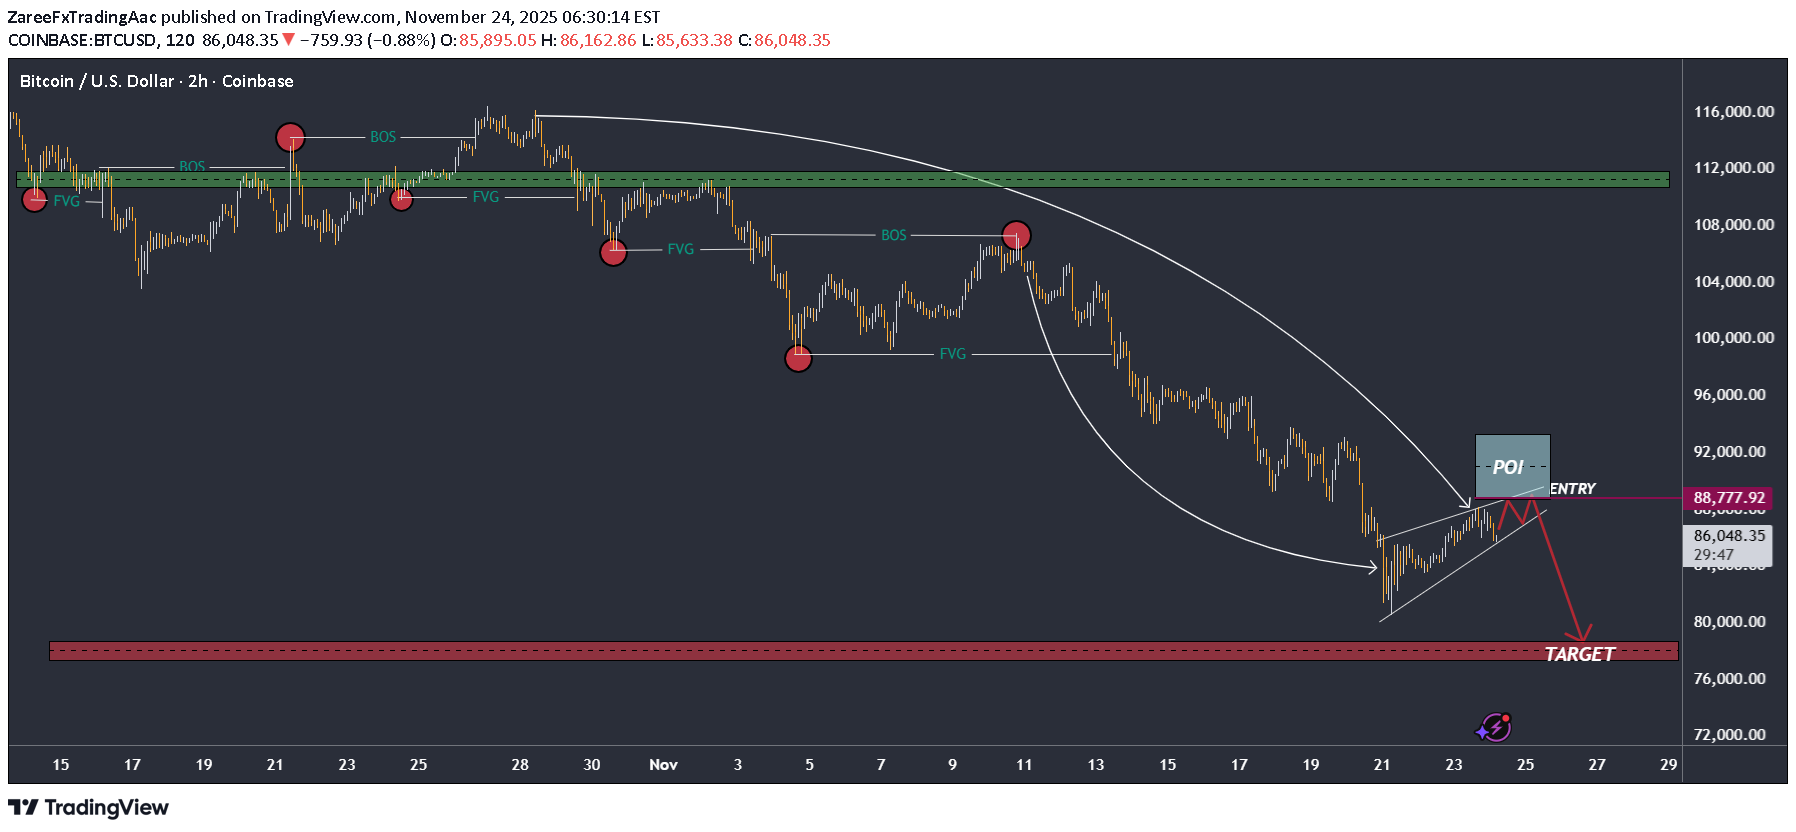
Chart Analysis Your chart illustrates a bearish market structure on the 2-hour timeframe with several important Smart Money Concepts (SMC) elements: 1. Macro Trend The large white curved arrow indicates an overarching downtrend. Multiple BOS (Break of Structure) points create a consistent bearish structure. 2. Key Supply Zone (Rejection Area) The green zone at the top represents a strong previous supply / distribution area. The market has consistently failed to maintain price above this zone, confirming its strength. 3. Fair Value Gaps (FVGs) Several marked FVGs show inefficiencies left behind during impulsive moves. The market is respecting these imbalances during retracements, which aligns with institutional flow. 4. Current Price Action The price is forming a rising wedge (bearish pattern) leading into the POI. A POI (Point of Interest) is highlighted near the $88,700–$89,000 zone. This POI aligns with: A previous BOS retest A small FVG fill Structural resistance This area is ideal for a short entry. 5. Bearish Expectation The chart shows expected liquidity grab into the POI (last push up). Then a sharp rejection downward toward the target zone. 6. Target Zone ($78,000–$80,000) Marked in red at the bottom. This is a major demand zone + liquidity pool from previous lows. Perfect alignment with SMC targets where price often seeks resting liquidity. 📉 Summary Your chart outlines a high-probability bearish setup: Expect a final push up into the POI Bearish rejection from $88.7k–$89k zone Downward continuation toward $78k–$80k Structure, FVGs, and BOS all support the bearish bias.