Technical analysis by The_Traders_House about Symbol DOT: Sell recommendation (11/24/2025)

The_Traders_House
آماده شدن پولکادوت (DOT) برای ریزش سنگین: فرصت شورت عالی از سطح کلیدی ۲.۲۴۶!
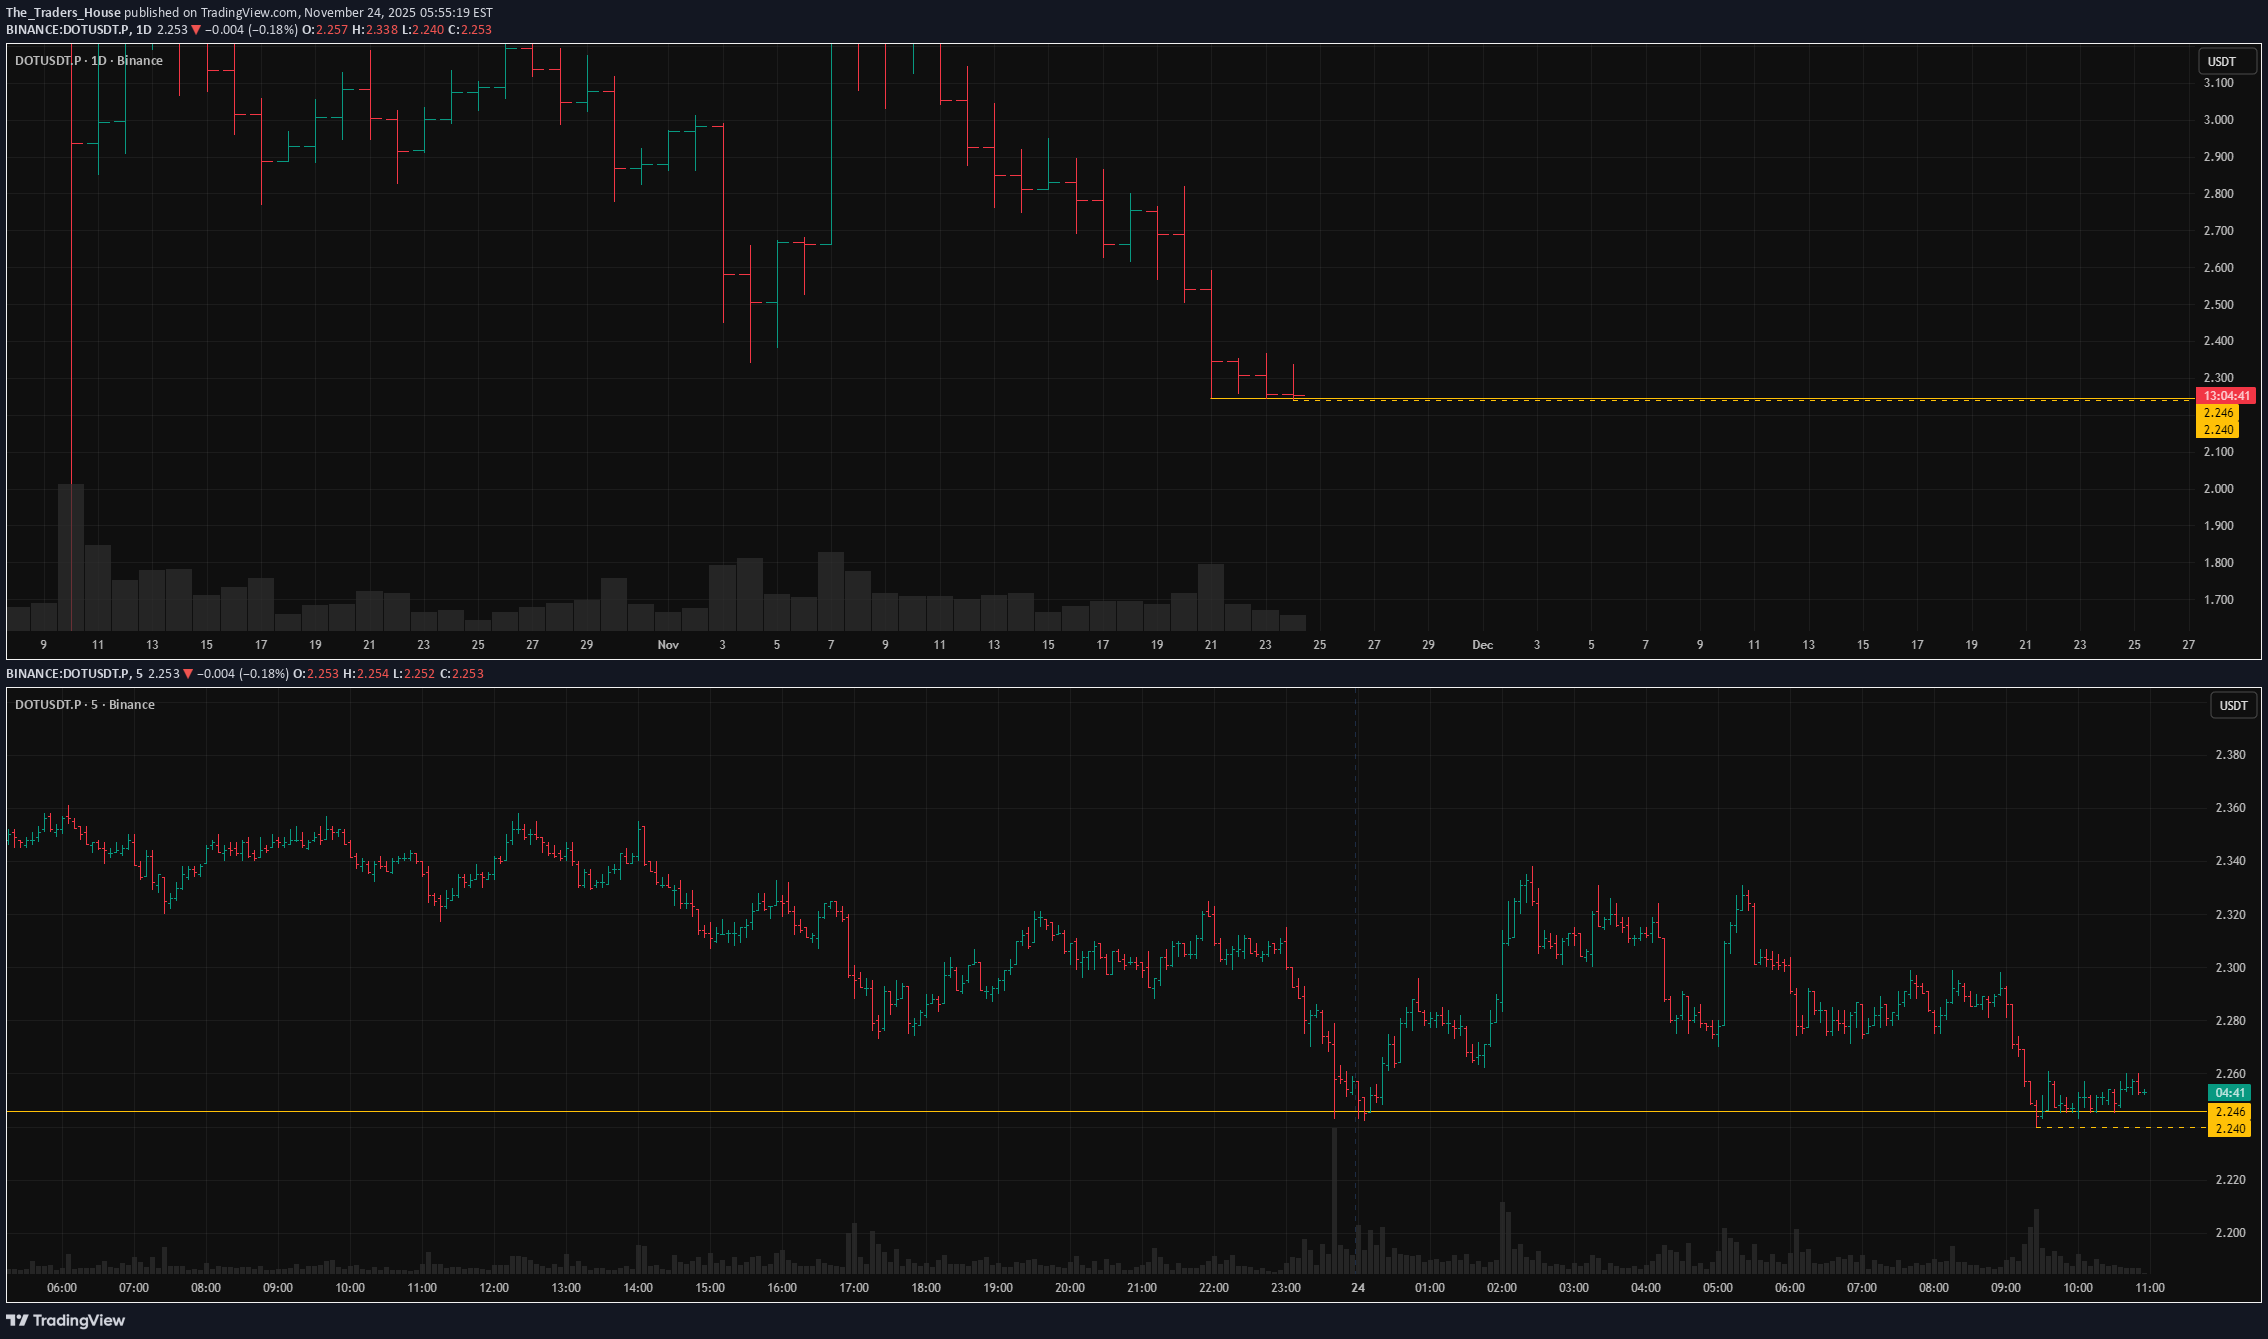
DOTUSDT.P looks almost ideal for a short scenario. The only downside is that we've seen two false breakouts already, although, on the flip side, this confirms the strength of the level. Overall, we have a local level with no obstacles to the downside since 10.10.25 — a day that essentially "cleared" the chart. Right now, a solid pre-breakout base is forming directly above the level. There is no buy reaction to the test, which signals seller strength. If volatility remains low, this could turn out to be an easy and technical short. Key factors for this scenario: Global & local trend alignment Price void / low liquidity zone beyond level Liquidity grab (false move against the trend) Volatility contraction on approach Immediate retest No reaction after a false break Closing near the level Closing near the bar's extreme Was this analysis helpful? Leave your thoughts in the comments and follow to see more.Breakout Logic: 1. Global & Local Trend Alignment Trading with the trend is always the path of least resistance. Aligning local price action with the global trend provides us with a significant statistical edge. 2. Price Void / Low Liquidity Zone A situation where there are no historical support or resistance levels beyond the breakout point. This means there are no visible obstacles to stop the asset from moving sharply in the breakout direction. 3. Liquidity Grab (False move against the trend) A trap. An attempt to pull the asset in the opposite direction that fails completely—sellers suppress buyers, pushing the price back to the level. This confirms the strength of the sellers (or lack of buyers). 4. Volatility Contraction on Approach A sign of a "strong hand." A major player doesn't create chaotic spikes by spamming market orders. Instead, they move confidently, systematically absorbing counter-orders as price approaches the level. Low volatility = preparation and control. High volatility = noise, low liquidity, or probing for limits. 5. Immediate Retest Price doesn't hit the exact same spot by accident. If we see repeated tests of the same price point within a short period (under 7 days), it signals a "close retest." This increases the probability of a breakout. 6. No Reaction after a False Break Indicates the defender is exhausted. Typically, a level defender leaves traces by bouncing the price away. If, after a test or false break, the price refuses to pull back and stays "glued" to the level, it shows the defender is too weak to push it away. 7. Closing Near the Level A strong signal for a breakout. It shows that the aggressor not only dragged the price to the level but kept it there to demonstrate dominance. It implies readiness to break through. 8. Closing Near the Bar's Extreme Similar to the point above. When a daily bar closes at its absolute low or high (no wick), it indicates clear intent. The momentum is strong, and the move is likely to continue into the next day.However, always remember: trading is about probabilities, not 100% certainty. Therefore, all these signals can be invalidated if a force appears in the market capable of going against them. Trade the facts, but manage your risks.We have two more hits on the level within the pre-breakout base. Crucially, volatility must remain low.This is a negative factor — volatility has increased. I need to see it contract. At least 1–2 low-volatility bars right before the breakout — that will be my signal to act.5 to 1!"At least 1–2 low-volatility bars right before the breakout — that will be my signal to act."