Technical analysis by Ratner about Symbol BTC: Buy recommendation (11/23/2025)

Ratner
بیت کوین در کمین: آیا گاوها به مقاومت ۹۲,۰۰۰ دلار میرسند؟
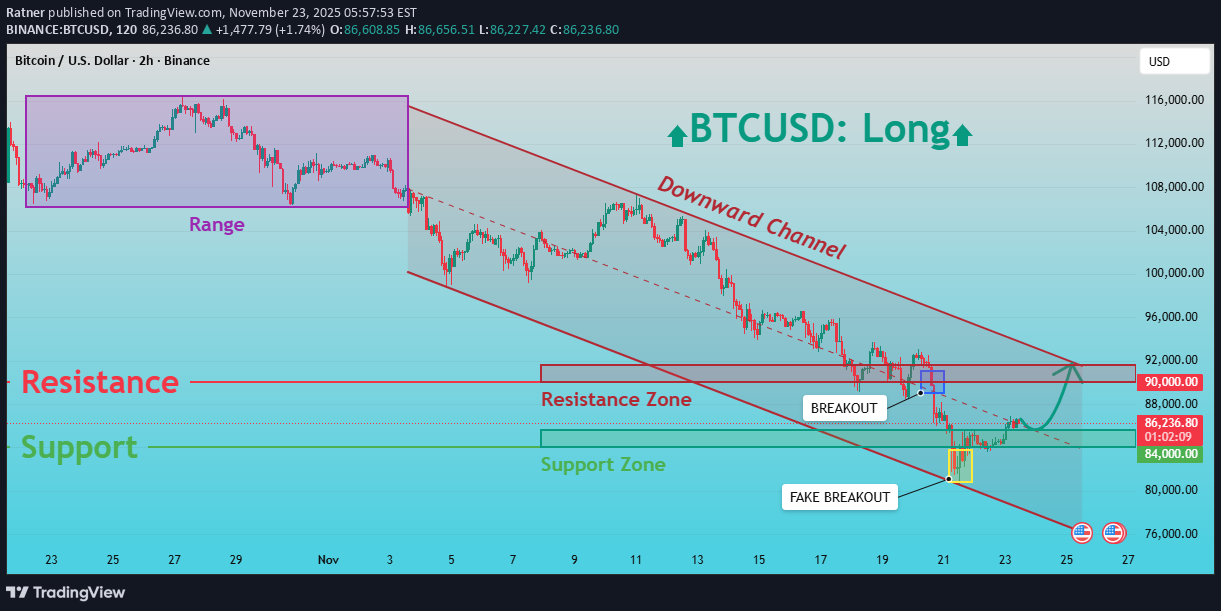
Hello everyone, here is my breakdown of the current Bitcoin setup. Market Analysis BTCUSD continues to move within a clearly defined Downward Channel, respecting both the descending resistance line and the lower support boundary. After a prolonged bearish continuation from the major Range structure seen earlier, Bitcoin broke several intermediate support levels before reaching the Support Zone around $84,000, where strong buyers stepped in. A Fake Breakout below the channel support triggered aggressive buying activity, sending the price back above the Support Zone and forming a short-term recovery structure. From this point, BTCUSD made a corrective bounce and even managed to break above a minor descending resistance, confirming a temporary shift in momentum. Currently, price is approaching the Resistance Zone near $88,000–$90,000, which aligns with the upper boundary of the Downward Channel. This area has previously generated strong sell-offs and remains the key obstacle for buyers. A clean breakout above $90,000 would signal bullish continuation and may lead to a deeper recovery toward the next liquidity cluster near $92,000–$94,000. As long as BTCUSD holds above the $84,000 Support Zone, the short-term structure supports a bullish correction. However, if price gets rejected from the $90,000 resistance and fails to stay above support, sellers may regain control and push the market back toward the lower channel boundary. My Scenario & Strategy From my perspective, BTCUSD maintains a bullish corrective outlook while respecting the Support Zone around $84,000. The first target remains the $90,000 Resistance Zone, which matches both horizontal resistance and the channel’s upper boundary. A confirmed breakout above $90,000 would open the path toward $92,000–$94,000, where the next reaction levels are located. I will look for long opportunities during pullbacks toward the Support Zone or along the rising minor trendline that formed after the fake breakout. If BTCUSD breaks back below $84,000, the bullish scenario becomes invalid, and a continuation of the major downward trend may follow. For now, price action supports a bullish recovery setup as long as buyers defend the Support Zone. That's the setup I'm tracking. Thank you for your attention, and always manage your risk.At this stage, as we expected, the price dropped to retest the support level, so we will watch and wait for further market action.We almost reached our target, but the market is still in a draw. Therefore, the price has entered a sideways range.