Technical analysis by bwy about Symbol BTC: Buy recommendation (11/20/2025)

bwy
آیا زمان فروش بیت کوین فرا رسیده است؟ تحلیل تخصصی نقاط ورود و خروج
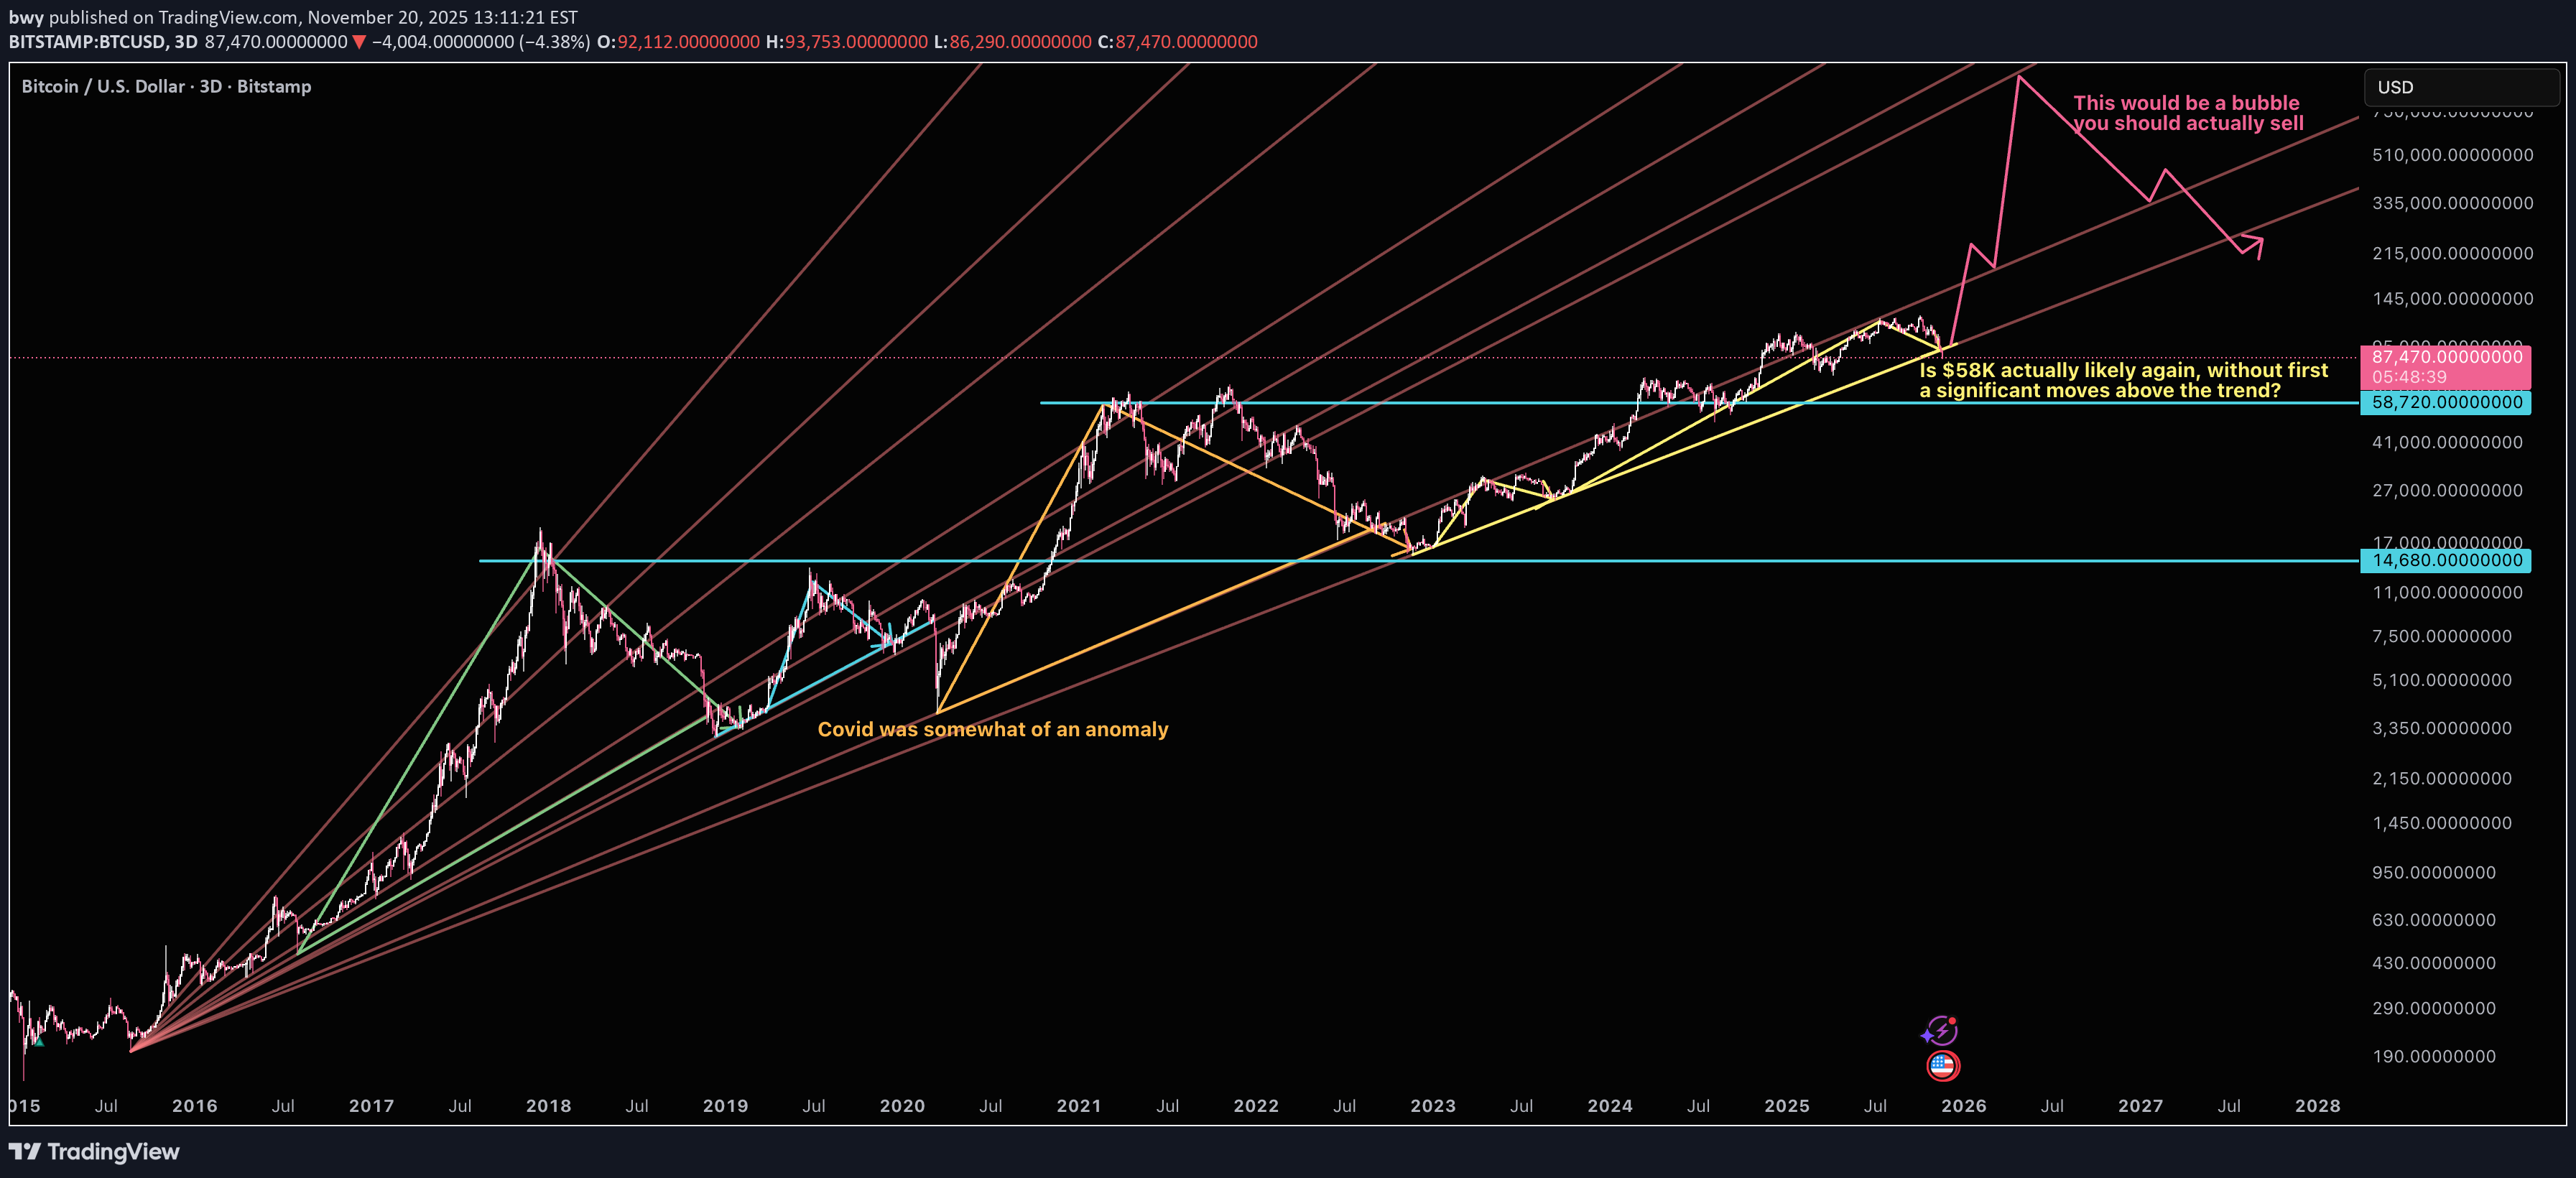
This chart is to offer up some guidance to those thinking of selling. Trend lines are made to be broken. They express the rate of increase at the absolute bottom of the selling. So when a trend line breaks you're now in the area you actually want to buy for long term as a new trend will form from that low. As you can see with past Bitcoin trends whenever there's a new low made, that's where the price eventually wants to come back to. And if the move above the trend was significant enough it will likely break it as people sell at the bottom. Currently as you can see from the Yellow section we are in a steady trend much like the latter part of 2016-2017. We've made small moves up to the previous (covid low) trend line and back down. These oscillations have been historically quite small. So any moves below this trend line are likely not to be significant. If Bitcoin ever attempts a move up into the covid low channel at makes it up to that upper trend line, That would be a significant rise and would very likely follow a significant fall. As for right now Bitcoin has breached the trend line slightly and is in what I would consider an opportunistic buy area with very low downside risk. Good luck!