Technical analysis by readCrypto about Symbol BTC on 11/19/2025

رمزگشایی بیت کوین: آیا قیمت روی ۸۹۲۹۴ دلار حمایت میشود؟
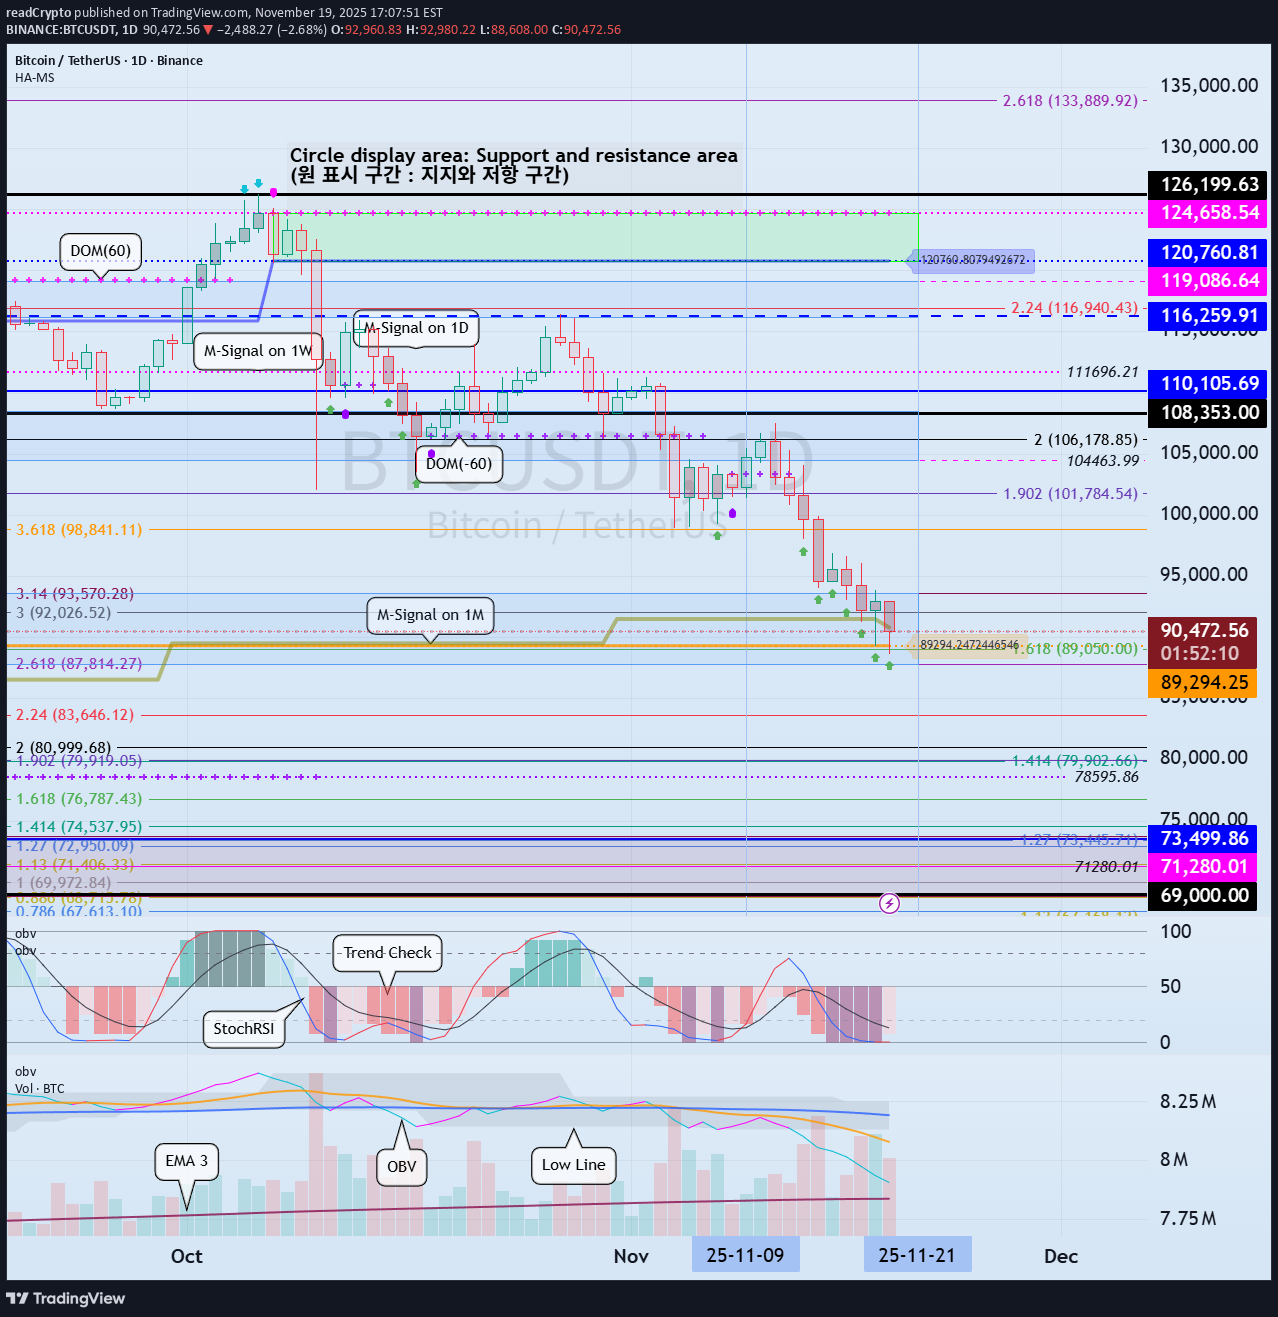
Hello, fellow traders! Follow us to get the latest information quickly. Have a great day. ------------------------------------- (BTCUSDT 1D chart) This period of volatility is expected to last until November 22nd. If the price fails to find support and rise near the M-Siganl indicator on the 1M chart after this period of volatility, it is likely to decline to the 69,000-73,499.86 level. Therefore, the key question is whether it can find support and rise near the HA-Low indicator level of 89,294.25 on the 1D chart. - (1M chart) It is showing a downward trend, failing to reach the Fibonacci ratio 2.618 (133,889.92), which was considered the target level. However, if the price maintains above the 69,000.0-73,499.86 level, it is expected to maintain an upward trend in the long term. - (1W Chart) If the price rises above the HA-High indicator, it is likely to form a stepwise uptrend. Since a stepwise uptrend usually ends in a decline, this decline could be a sign of a bearish trend. The M-Signal indicator on the 1M chart can be used as a benchmark for bullish and bearish trends. Therefore, if the price remains below the M-Signal indicator on the 1M chart, it should be considered a bearish trend and a response should be considered. However, considering the overall trend of BTC, the most important range is the 69,000-73,499.86 range. As long as it does not fall below this range, the price is expected to maintain an upward trend in the long term. - Thank you for reading to the end. I wish you successful trading. -------------------------------------------------- - This is an explanation of the big picture. (3-year bull market, 1-year bear market pattern) I will explain in more detail when the bear market begins. ------------------------------------------------------