Technical analysis by BeInCrypto about Symbol HBAR: Sell recommendation (11/19/2025)

BeInCrypto
آیا هَدرا (HBAR) در آستانه سقوط است؟ سطح حمایتی حیاتی که باید مراقبش باشید!
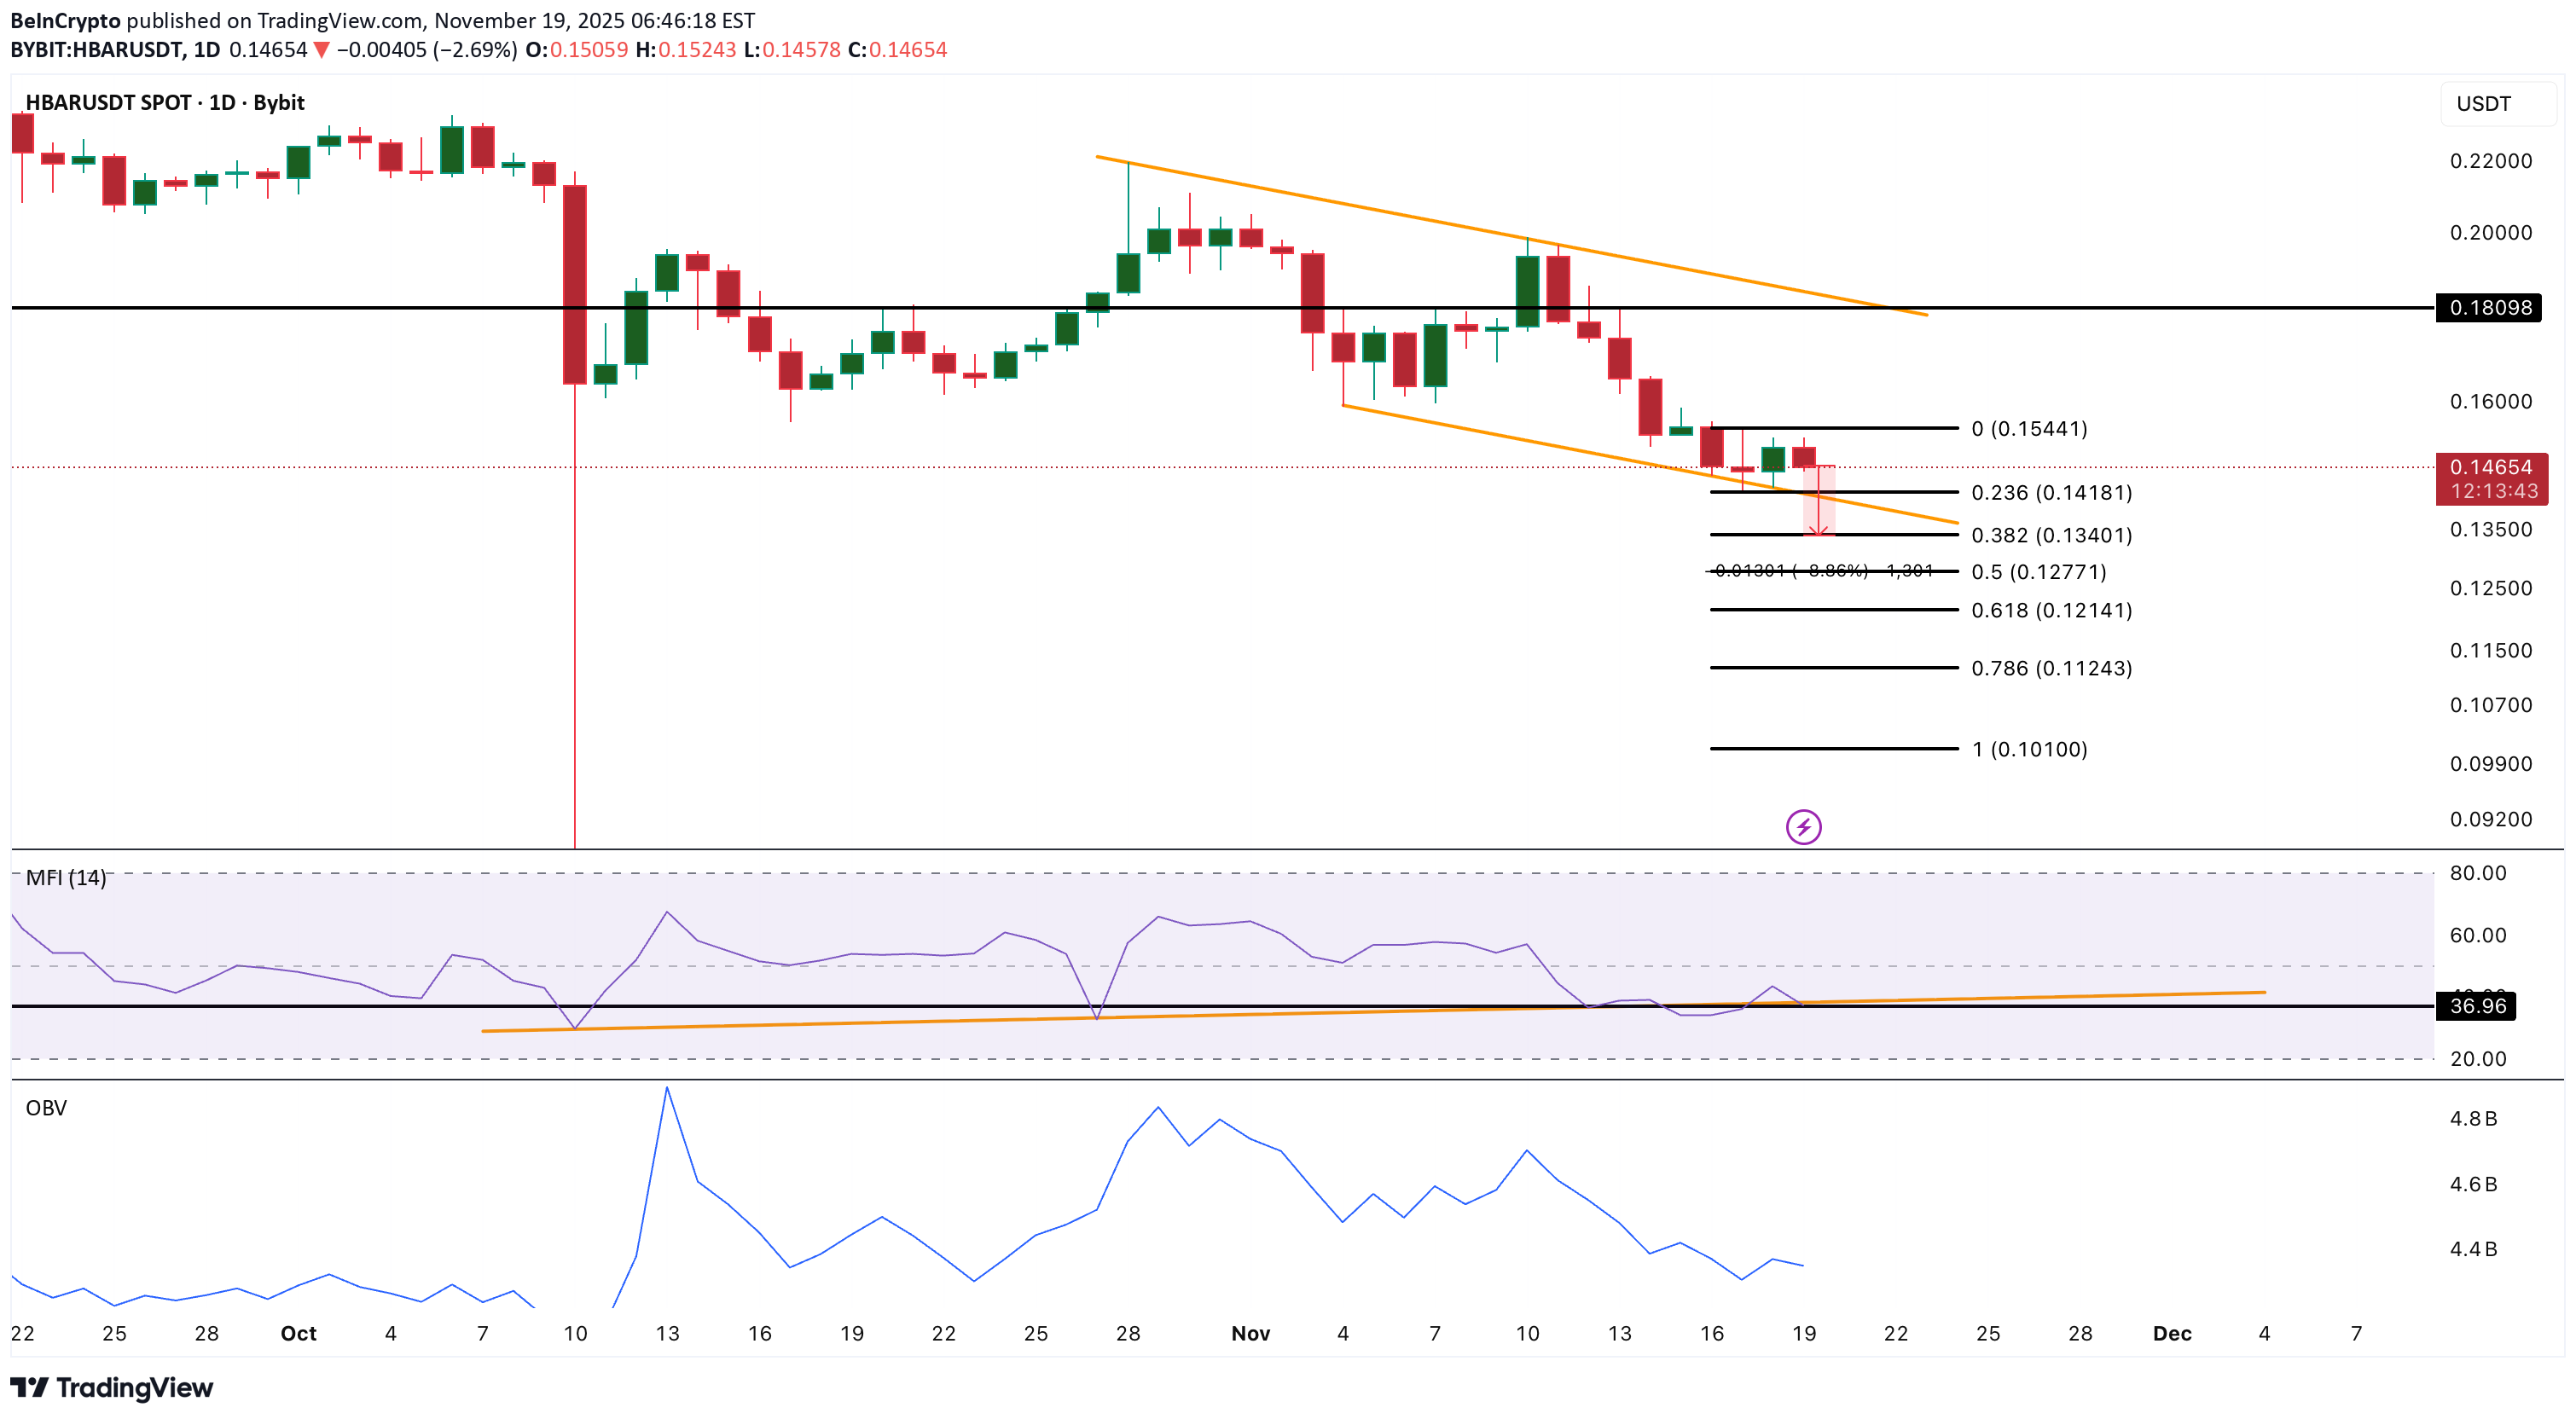
HBARUSDT trades near $0.146 after dropping almost 19% this week and nearly 39% over the past three months. The daily chart shows the Hedera token sitting right above the lower boundary of its falling channel, with $0.141 as the final support that keeps the structure from breaking. Money Flow Index, which tracks whether dip buying is strong or weak, has slipped back under its trend line again. It had been making higher lows even as the price made lower lows, but that strength has now faded. If MFI drops under 36, it confirms that dip buyers have stepped back. On-Balance Volume tells the same story. OBV remains weak and continues to lean downward, showing sellers still control most of the recent trading activity. If $0.141 holds, HBARUSDT can attempt a move toward $0.154 and then $0.1808. A daily close below $0.141 exposes $0.134 and keeps the downtrend in full control. Hidden bearish divergence on the 12-hour chart only reinforces the risk.